


- Introduction
- Function Introduction
- Performance Monitor
- Fusion Hunter
- Quantitative Chart
- SEC Filing
- Insider Trading (Search by Ticker)
- Insider Trading (Search by Reporter)
- Insider Trading (Top Insider Trading)
- Institutional Holdings
- Investment Trends (Investment Company List)
- Investment Trends (Sector & Industry Sentiment)
- Investment Trends (Investment Company Sentiment)
- Investment Trends (Top Institutional Trading)
- Investment Trends (Top Institutional Hldg Change)
- Key Ratio Distribution
- Screener
- Financial Statement
- Key Metrics
- High Current Difference
- Low Current Difference
- Relative Strength Index
- KDJ
- Bollinger Bands
- Price Earnings Ratio
- Price to Book Value
- Debt Equity Ratio
- Leverage Ratio
- Return on Equity
- Return on Assets
- Gross Margin
- Net Profit Margin
- Operating Margin
- Income Growth
- Sales Growth
- Quick Ratio
- Current Ratio
- Interest Coverage
- Institutional Ownership
- Sector & Industry Classification
- Data Portal
- API
- SEC Forms
- Form 4
- Form 3
- Form 5
- CT ORDER
- Form 13F
- Form SC 13D
- Form SC 14D9
- Form SC 13G
- Form SC 13E1
- Form SC 13E3
- Form SC TO
- Form S-3D
- Form S-1
- Form F-1
- Form 8-k
- Form 1-E
- Form 144
- Form 20-F
- Form ARS
- Form 6-K
- Form 10-K
- Form 10-Q
- Form 10-KT
- Form 10-QT
- Form 11-K
- Form DEF 14A
- Form 10-D
- Form 13H
- Form 24F-2
- Form 15
- Form 25
- Form 40-F
- Form 424
- Form 425
- Form 8-A
- Form 8-M
- Form ADV-E
- Form ANNLRPT
- Form APP WD
- Form AW
- Form CB
- Form CORRESP
- Form DSTRBRPT
- Form EFFECT
- Form F-10
- Form F-3
- Form F-4
- Form F-6
- Form F-7
- Form F-9
- Form F-n
- Form X-17A-5
- Form F-X
- Form FWP
- Form G-405
- Form G-FIN
- Form MSD
- Form N-14
- Form N-18F1
- Form N-18F1
- Form N-30B-2
- Form N-54A
- Form N-8A
- Form N-CSR
- Form N-MFP
- Form N-PX
- Form N-Q
- Form TTW
- Form TA-1
- Form T-3
- Form SC 14F1
- Form SE
- Form SP 15D2
- Form SUPPL
- Form 10-12G
- Form 18-K
- Form SD
- Form STOP ORDER
- Form TH
- Form 1
- Form 19B-4(e)
- Form 40-APP
- Form 497
- Form ABS-15G
- Form DRS
- Form MA
- Form UNDER
- AI sentiment
- Access guide
- Academy
- Term of service
- GDPR compliance
- Contact Us
- Question Center
| Font Size: |
Fundamental Screener
- Introduction
- Query Mode
- Quantile Slider
- Regular Slider
- Toggle Slider
- Force Comparison
- Fields Structure
- Best Practice
Important Notice: Starting from July 2018, Fusion hunter is online, which provides richer functions than "Screener" module and is updated daily. "Fusion hunter" module is recommended for short to medium term investors. "Screener" module still has advantages in batch view/sorting of fundamental indicators, and is recommended for medium to long term investors with more focus on the fundamental side.
Introduction
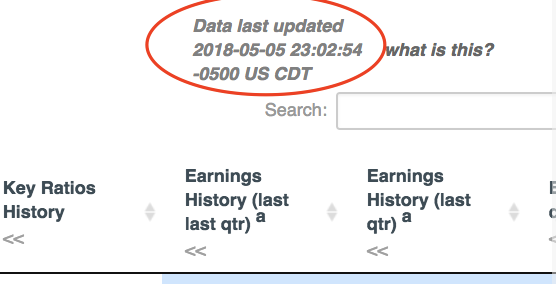
Fundamental screener provides quick access to a list of publicly traded securities meeting user specified filtering criteria. It offers a set of highly diversified financial metrics to be customized on, and different search scopes (whole market, sector, industry) to start with. Specifically, users can limit search scope to one of the 13 sectors, 108 industries, or the whole US market. We pre-calculated the distribution of all financial metrics for each scenario, so the sliders are specific to the scope being worked on. The data used by the sliders, and shown in the screening results table are updated weekly at the end of each Saturday. The detailed last update time can be found at the top right corner of the result table.
Majority of the financial metrics are adjusted through quantile ranking score [0~100], which we believe makes more sense for investors without prior knowledge about the general distribution of specific metric in specific industry/sector. The actual values are shown in the parentheses of the slider handles, so users can know immediately the actual value of specific ranking score in corresponding screening scope.
As of April 2018, we started to add key metrics for technical analysis to the screener function. Metrics like RSI-W14 (Weekly Relative Strength Index, 14 weeks), RSI-W5, and KDJ are now available for screening. Investors can now use the technical indicators together with a rich set of fundamental indicators to quickly narrow down the watch list for taking either long or short position. We are also working actively to include more useful technical indicators in the future. The best practice guide below examplifies how to find potential target for taking long position, using a combination of existing technical and fundamental indicators.
Query Mode
Config & Submit: By default, users should config the sliders first, and then click the green submit button located at the top or the bottom (both the same) of east panel. We recommend to use "Config & Submit" mode by default since your web browser needs to prepare and arrange a lot of html components before the results can be displayed.
Instant Query: When the instant query check box is selected, queries will be posted immediately to our server when any slider detects change (enabled/disabled/moved). This option can be considered when the screening criteria is strict and very few (e.g. less than 10) results are expected. Also we do not recommend instant query for computer with poor CPU performance or IE browser.
Quantile Slider
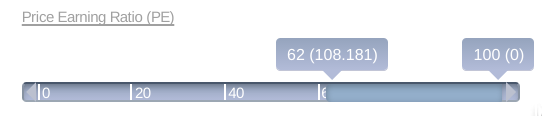
Quantile sliders are used for metrics for which quantile ranking has been calculated. A Quantile slider has a range of 0 to 100 (stepped by 2) with each quantile corresponds to a specific value of corresponding financial metric. For example
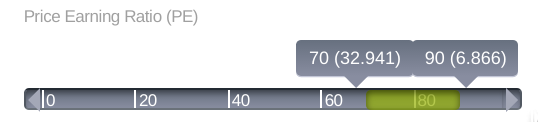
The figure above shows the PE ratio slider for energy sector as of 2016-06-17. Note the slider starts from 0 on the left and ends at 100 on the right, stepped by 2 (i.e. the smallest unit is 2). The currently selected range is from 70th quantile (actual value is 32.9) to 90th quantile (actual value is 6.9). (See performance monitor for how quantile ranking is determined for each financial metric)
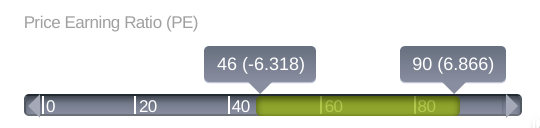
By sliding the left handle to 46, a wider range of securities will be shown in the search results. Note that the actual PE ratio at 46th quantile is -6.318, indicating at least 46% companies in the energy sector have negative earnings (as of 2016-06-17).
Regular Slider
Regular sliders are used for metrics for which quantile ranking is not calculated (because original value is better than quantile value in this scenario). The range of a regular slider is same as the range of the corresponding metric under the search scope. For example
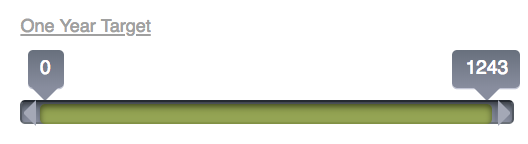
The slider above shows the range of one year target for technology sector as of 2018-05-04. Note the maximum target price is $1243, which is the original metric value.
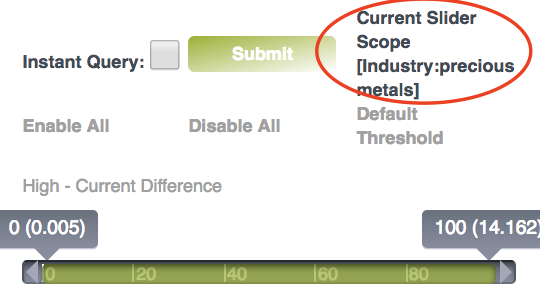
Toggle Slider
Each metric can be toggled(i.e. enable/disable) by clicking corresponding title. A metric is not factored into the screening process when the slider bar is greyed out, as shown below.
Important! The effect of disabling a slider (i.e. greyed out) is different from enabling a slider with full range. In the former case NULL value is deemed qualified. In the latter case the metric must have a valid numeric value to be qualified.
Force Comparison
By inputing ticker(s) into the "compare:" query box, users can force include ticker(s) of interest in the screening results. The image below illustrates the effect of including AAPL and SBUX in the screening results.
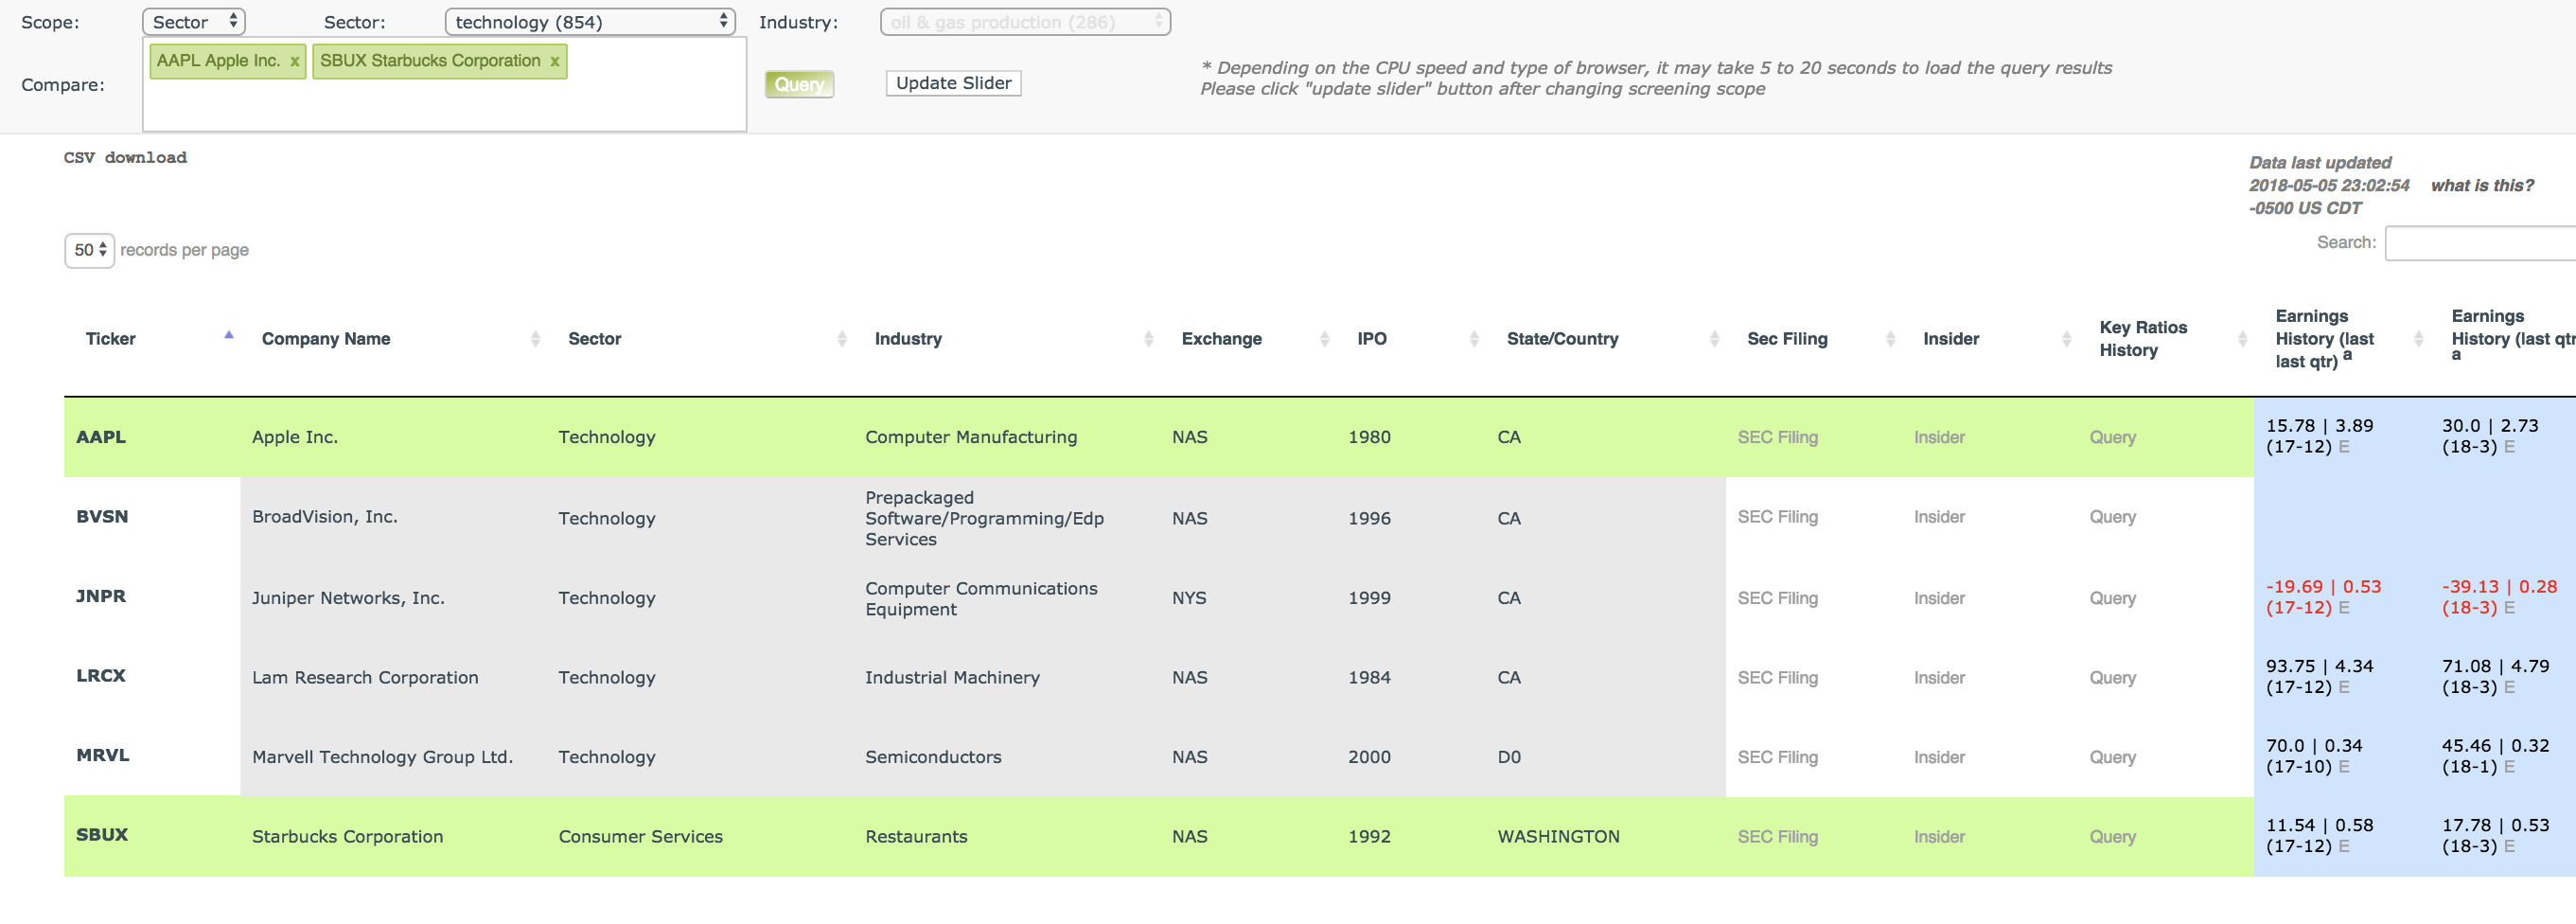
The records that are forced to be included in the screening results are highlighted with green background and ordered alphabetically.
Tips: The force comparison function of screener can be utilized to quickly compare several tickers (currently maximum of 5) of interest, by configuring two or more sliders to form extreme filtering criteria, and thus no symbol is qualified.
Fields Structure
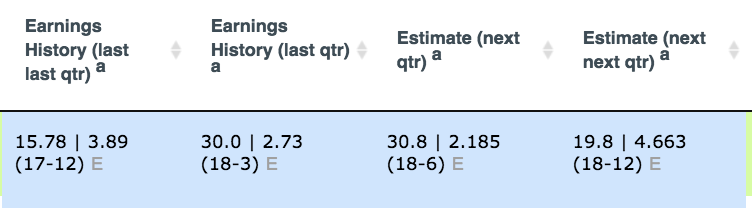
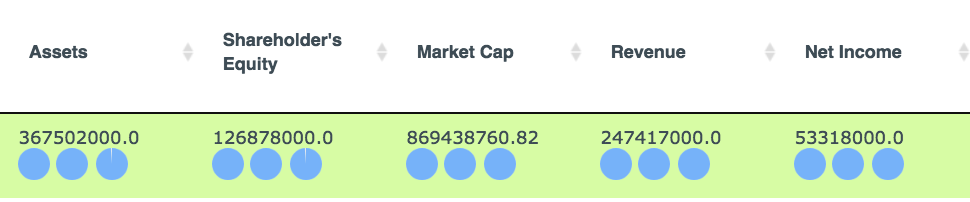
The table containing the screening results is composed of four major parts: the annotations, links for making detailed query, earnings, and key financial metrics.
The annotation fields contain basic information about each ticker. The fields containing query link provide shortcuts to sec filings, insider tradings, and key ratio histories.

The earnings fields provide earning histories, and future earning estimates for the closest two fiscal quarters.
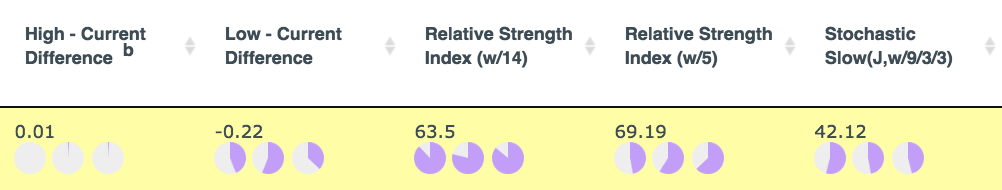
The fields containing key financial metrics is composed of four sub sections (technical indicators with quantile ranking, fundamental indicators with quantile ranking, neutral indicators, regular indicators).
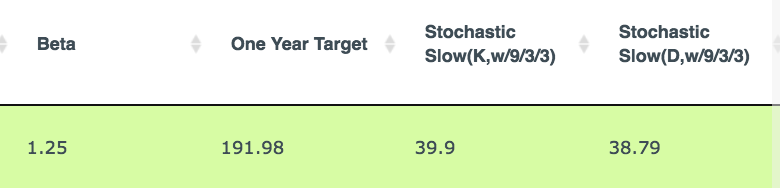
Technical indicators with quantile ranking.
Fundamental indicators with quantile ranking


Company scale indicators. We use blue color for these indicators to emphasize that the scale of a company does not reflect its financial health. However, a large company is generally considered to have less risk, and better chance to survive during economic downturn than a small company,
Regular indicators. They are metrics for which quantile rankings are not calculated (primarily because quantile ranking is considered not necessary for them) and thus the original values are directly used for screening.
Tips: Column(s) can be hidden by clicking (<<)(mouse over to display) under corresponding header. The browsing habits are recorded for users who logged in, so next time unwanted fields will not be displayed to speed up the loading process.
Best Practice
This best practice is drafted in view of the complexity of the indicators, which may hinder common investors from making effective use of it. Here we present a general guidance on how to quickly narrow down the watch list (for long position). When applied properly, the guidance can help you build a portfolio that generate a considerable return (> 10%) in a short time period (few weeks), without significant risk been observed.
We recommend this guidance as the bast practice for common investors who have limited time to digest the complex financial statement, and investigate the industrial background of a publicly traded company. It is noteworthy that we do not rule out other investment strategies for more sophisticated investors.
We present the guidance in three parts. Part 1 introduces how to config fundamental indicators. Part 2 introduces how to config technical indicators. Part 3 discusses other considerations that may help to reduce the risk of investment.
Fundamental indicators
Step 1: Determine the scope of your query
By default the screening will be performed on the whole US market. However, you can limit your query to specific sector or industry through the options provided in the navigation panel. Usually, the reasons for doing so may include but not limited to 1) you are familiar with a specific area and know the caveats better than common investors. 2) you are building a diversified portfolio and want to take a position in specific sector or industry. 3) a sector of industry has been oversold and has reached a turning point.
No matter what the reason might be, keep in mind that different sectors or industries have different distribution of financial metrics. We have all these handled for you, and just by clicking the "Update Slider" button after determining your scope of interest, the sliders will be automatically updated to reflect the most recent distribution of corresponding scope.
You can keep the scope untouched and use the default (the whole US market), in which case the distribution is generated based on all securities traded on the market.
Step 2: Remove companies with poor financial condition
This is important because you don't want a "dancing on the cliff". A company with poor financial condition may generate short term return due to reasons like the presence of bargain-hunting fund, but may also destroy your portfolio overnight. While the financial condition of a company is determined by many financial metrics, and for the same metric there are different criteria from different investors, we must point out that some commmon sense should be applied. They are, in descending order of importance (in determining a poor financial condition),
- Very high debt equity ratio
- Very low operating margin or net profit margin
- Serious decline in income or sales
- Very Low quick ratio
Note it is hard to compose a list like the one above, that can be used to claim a good financial condition. This is because usually several metrics (and some are not reflected on the financial statement) must be combined to make such a claim. However, when a company met any of the criteria listed above, we can almost immediately tell the company is in poor financial condition. We strongly recommend investors to stay away from those companies, no match how attractive their other metrics, either a technical or fundamental metric, may look like.
Generally, we recommend the following threshold (the quantile rankings are based on the scope been selected)
- Debt equity ratio: better than 20% peers, and should not exceed a maximum of 3
- Operating margin and net profit margin: better than 40% peers, and should not be a negative number
- Income growth and sales growth: better than 40% peers, and should have a stable performance over time
- Quick ratio: better than 30% peers, and should be higher than 0.6
The list above is a general guidance, and should not be used as a dogma. In practice, we recommend users to play with the sliders to get a feeling about the distribution of each indicator, and set a range that generally consistent with our guidance.
Step 3: Select securities with a reasonable price tag
How much should you pay for a single share of a publicly traded company? This complex question is usually simplified into evaluating two financial metrics -- PE ratio, PB ratio. This could be a tough work for common investors since there is no gold standard for either metrics. Our recommendation is to stay away from outliers (extremely high or extremely low).
- PE ratio: ranks between 30% and 90%, and should not be a negative number (i.e. negative earnings) or higher than 50
- PB ratio: ranks between 10% and 90%, and should not be higher than 8 or lower than 1
Again, we recommend users to play with the sliders to get a feeling about the distributions, and set a range that generally consistent with our guidance.
Technical indicators
Step 1: Determine the location of current stock price
The "location" means "how far the current price is away from one year high and low". We recommend to be vigilant about stocks at or close to one year peak (unless you know all the caveats), since usually such stocks are overbought. In another word, you most likely have missed the best timing to take a long position. We measure the gap between one year high and current price with HCD (High Current Difference), and recommend HCD better than at least 10% peers.
On the other hand, stay cautious with the stocks close to one year low. Don't buy a stock just because it is "much cheaper than before". There must be reason(s) for a stock to plunge, and nobody know where the bottom is. We measure the gap between one year low and current price with LCD (Low Current Difference), and recommend LCD better than at least 10% peers.
Step 2: Determine the momentum of a stock
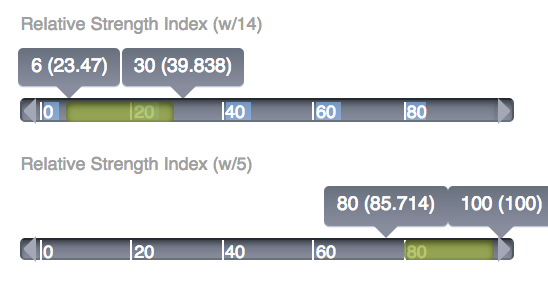
The screener module currently provides two technical indicators, RSI-W14 and RSI-W5, to monitor the mid-to-long term momentum of a stock. Actually, by simply using RSI-W14 and RSI-W5, we can figure out the price movement pattern without looking at the price chart.
a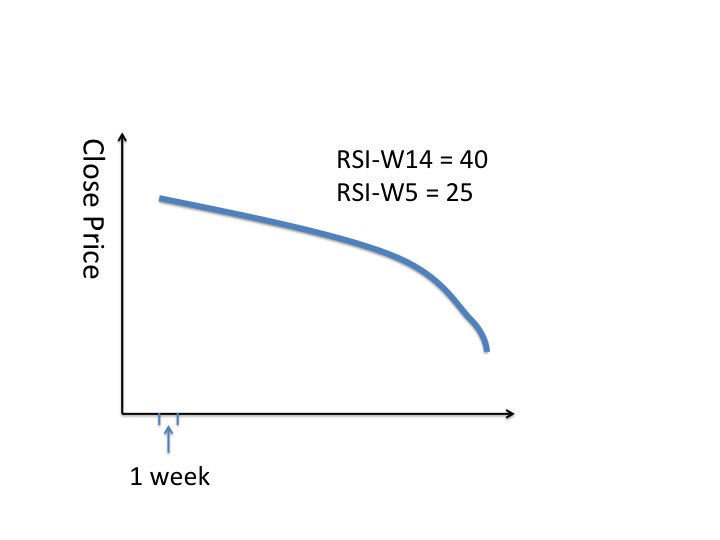 |
b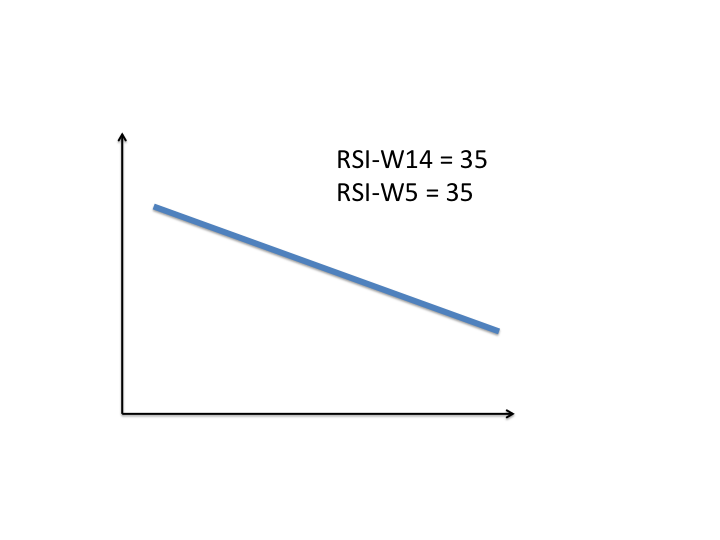 |
c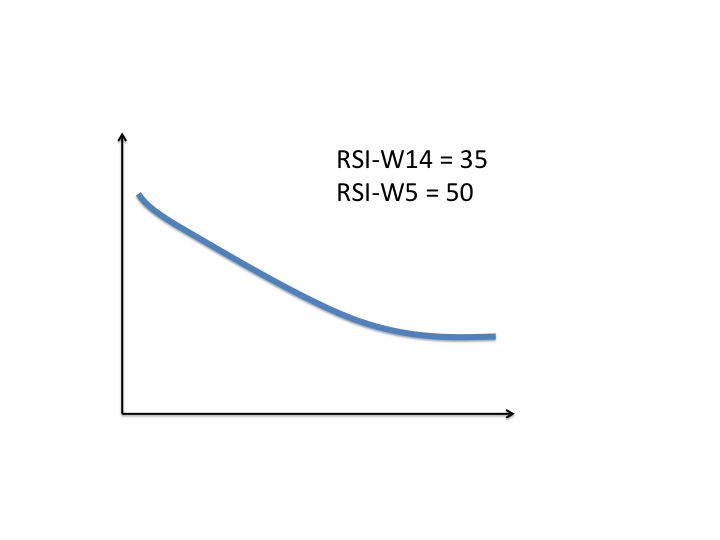 |
d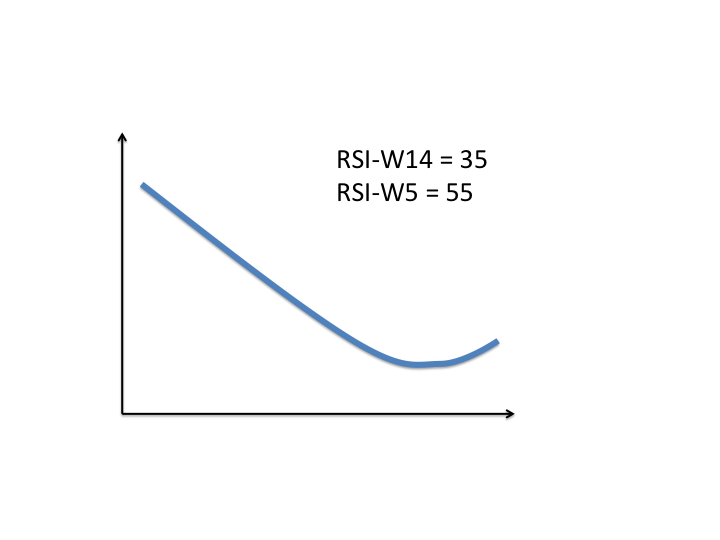 |
e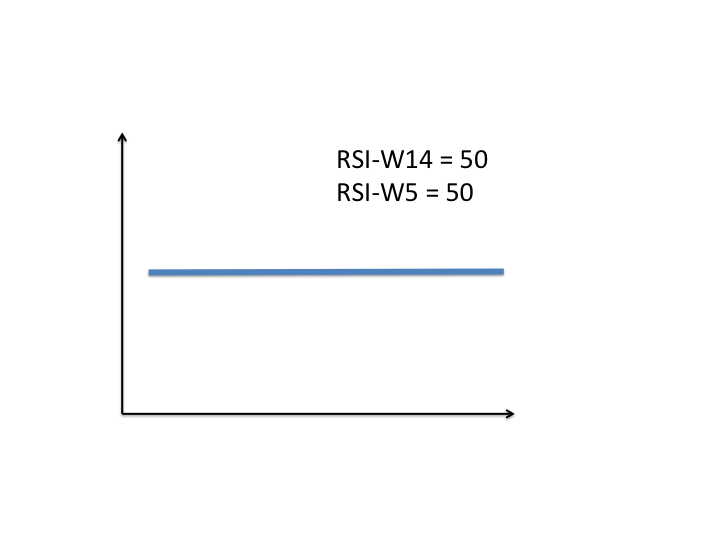 |
f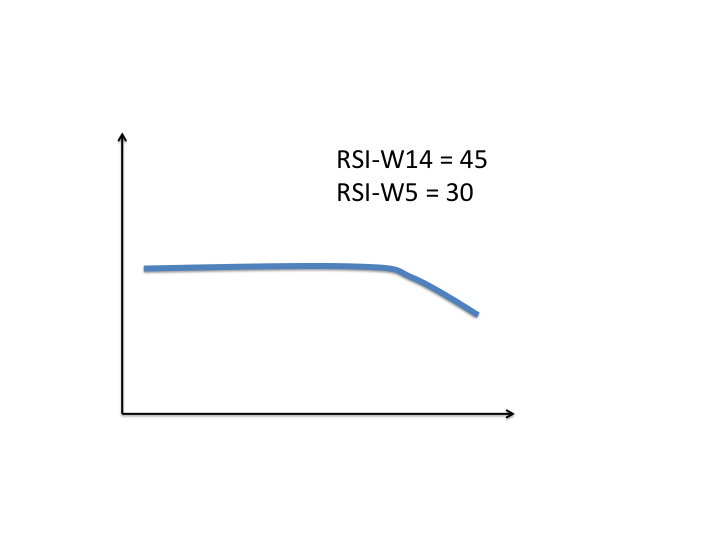 |
g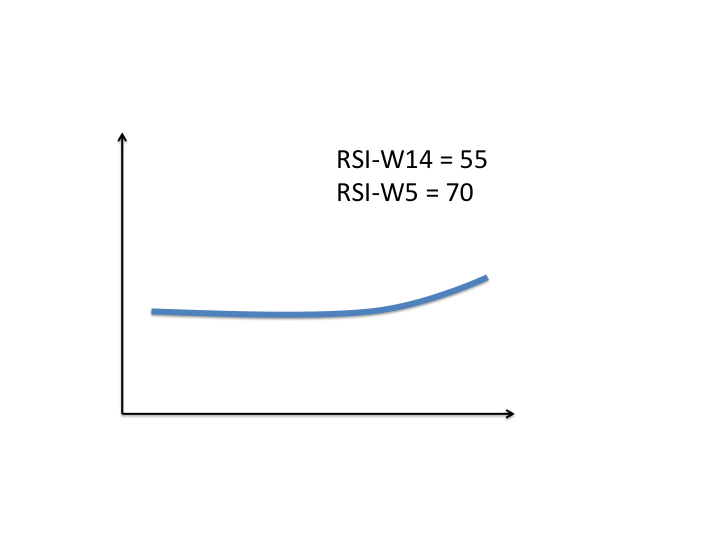 |
h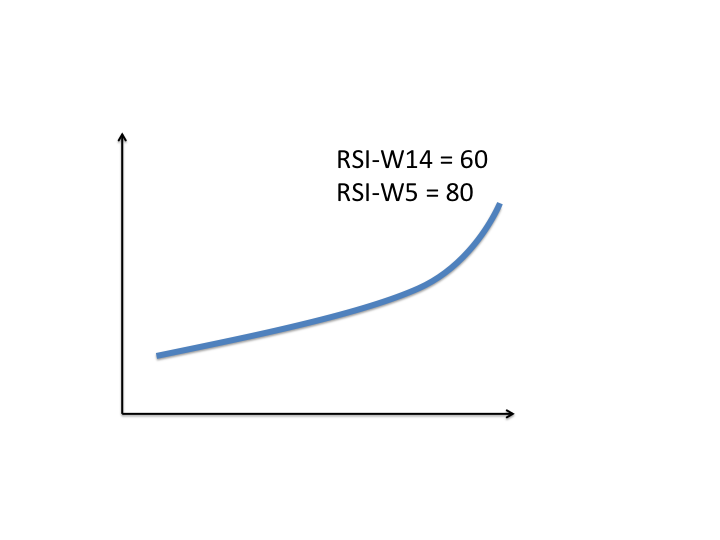 |
i |
j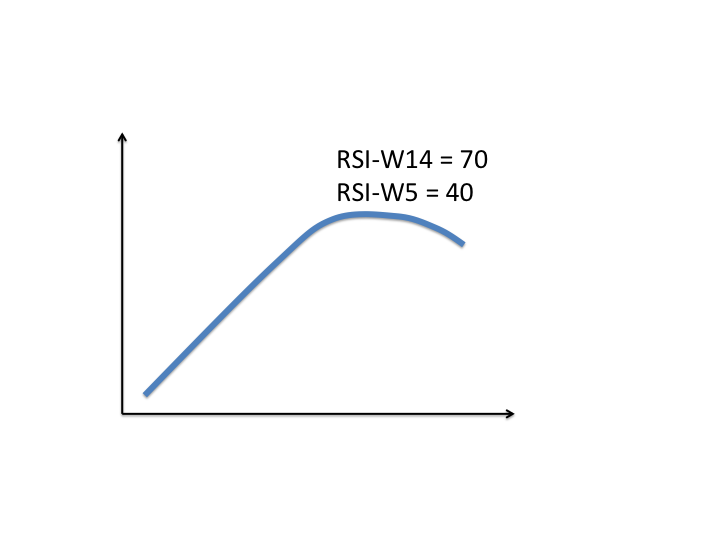 |
The images above, while not a comprehensive list, showcase how RSI-W14 and RSI-W5 reflect patterns of price movement. In this guidance, we recommend common investors to consider patterns like d,g,c*. Note the premise for making such selection is that we have gone through all the fundamental and technical steps to ensure the financial health of a company.
Usually, patterns like d,g,c appear after earnings beats forecasts. In this case, it is generally safe to keep the long position for a long period (several weeks or months) until exit signal appears.
In practice, you can config the RSI-W14 and RSI-W5 sliders to select the stocks with the pattern of your interest. For example, the following configurations select a very bearish stock with stong rebounce. However, the rebounce is so strong that you probably have missed the best timing to take a long position.
*We do not rule out other options for more sophisticated investors
Step 3: Determine entry point
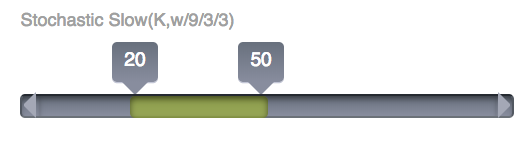
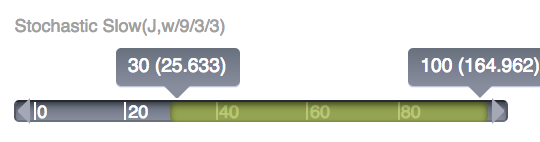
"Timing is everything". This should be a motto of every investor. The screener provides weekly (9 weeks) stochastic oscillator slow (also known as KDJ) to help investors determine the entry and exit point. There are three sliders (regular slider K, D, and quantile slider J) to config with. Basically, the best weekly entry point appears when K line crosses 20 in a bullish manner (i.e. from below 20 to above 20), and have K larger than D. The divergence bewteen K and D is measured by J (J = 3*K - 2*D). The larger the divergence, the stronger the upward momentum. Users can also rely on the quantile ranking of J to know the strength of the momentum relative to peers.
In this best practice, we recommend to set K between 20 and 50, and J above at least 30% peers. Make sure K is above D in the screening results.
Sometimes weekly KDJ and daily KDJ may give conflicting signal (e.g. weekly K crosses 20 in a bullish manner, daily K crosses 80 in a bearish manner). In this case, we recommend setting up a position with a small amount of funds and then increasing it as appropriate.
Do not rush to take a long position before K line reaches 20 from below. Under majority circumstances rely on a premature K line signal causes loss.
Part 3: Other considerations
Ensure liquidity
A stock with poor liquidity often has a large gap between bid and ask price, which sometimes makes investors hard to clear a position without suffering significant loss. Moreover, many technical indicators do not work for illiquid stocks, making it hard to determine entry and exit point. We recommend to select stocks with the ratio of average trading volume to shares outstanding higher than at least 4%-10% of peers.
Take a look at the scale of a company
We recommend to put a relatively small percentage of your investment in small companies, which generally have less reputations and are more vulnerable to unforeseen disasters. So keep an eye on the company scale indicators before making investment decision.
Diversify your portfolio
This is probably the most effective way to reduce the risk of investment. We strongly recommend investors to have a diversified portfolio, and do not investment more than 20% of your money in a single stock, no matter how attractive it may look like. A sophisticated investor should also put money in different industries to avoid unpredicted recession of a whole industry. A good example is the energy sector between July 2014 and January 2016. During which most stocks in the oil and gas production industry lost 50%-90% of their values.