


- Introduction
- Function Introduction
- Performance Monitor
- Fusion Hunter
- Quantitative Chart
- SEC Filing
- Insider Trading (Search by Ticker)
- Insider Trading (Search by Reporter)
- Insider Trading (Top Insider Trading)
- Institutional Holdings
- Investment Trends (Investment Company List)
- Investment Trends (Sector & Industry Sentiment)
- Investment Trends (Investment Company Sentiment)
- Investment Trends (Top Institutional Trading)
- Investment Trends (Top Institutional Hldg Change)
- Key Ratio Distribution
- Screener
- Financial Statement
- Key Metrics
- High Current Difference
- Low Current Difference
- Relative Strength Index
- KDJ
- Bollinger Bands
- Price Earnings Ratio
- Price to Book Value
- Debt Equity Ratio
- Leverage Ratio
- Return on Equity
- Return on Assets
- Gross Margin
- Net Profit Margin
- Operating Margin
- Income Growth
- Sales Growth
- Quick Ratio
- Current Ratio
- Interest Coverage
- Institutional Ownership
- Sector & Industry Classification
- Data Portal
- API
- SEC Forms
- Form 4
- Form 3
- Form 5
- CT ORDER
- Form 13F
- Form SC 13D
- Form SC 14D9
- Form SC 13G
- Form SC 13E1
- Form SC 13E3
- Form SC TO
- Form S-3D
- Form S-1
- Form F-1
- Form 8-k
- Form 1-E
- Form 144
- Form 20-F
- Form ARS
- Form 6-K
- Form 10-K
- Form 10-Q
- Form 10-KT
- Form 10-QT
- Form 11-K
- Form DEF 14A
- Form 10-D
- Form 13H
- Form 24F-2
- Form 15
- Form 25
- Form 40-F
- Form 424
- Form 425
- Form 8-A
- Form 8-M
- Form ADV-E
- Form ANNLRPT
- Form APP WD
- Form AW
- Form CB
- Form CORRESP
- Form DSTRBRPT
- Form EFFECT
- Form F-10
- Form F-3
- Form F-4
- Form F-6
- Form F-7
- Form F-9
- Form F-n
- Form X-17A-5
- Form F-X
- Form FWP
- Form G-405
- Form G-FIN
- Form MSD
- Form N-14
- Form N-18F1
- Form N-18F1
- Form N-30B-2
- Form N-54A
- Form N-8A
- Form N-CSR
- Form N-MFP
- Form N-PX
- Form N-Q
- Form TTW
- Form TA-1
- Form T-3
- Form SC 14F1
- Form SE
- Form SP 15D2
- Form SUPPL
- Form 10-12G
- Form 18-K
- Form SD
- Form STOP ORDER
- Form TH
- Form 1
- Form 19B-4(e)
- Form 40-APP
- Form 497
- Form ABS-15G
- Form DRS
- Form MA
- Form UNDER
- AI sentiment
- Access guide
- Academy
- Term of service
- GDPR compliance
- Contact Us
- Question Center
| Font Size: |
Investment Trends
Sector & Industry Sentiment
This module monitors the institutional holdings reported on Form 13F, which is filed within 45 days after each quarter end (i.e. Mar 31st, Jun 30th, Sep 30th, Dec 31st). The results are grouped by sector and by industry, separately.
The data are updated daily around 6:00 AM US CDT.
Sector Sentiment
Sector sentiment provides summarization of the institutional holdings in twelve sectors. Two presentation schemes are used. While both schemes determine the proportion of each sector (as denoted by the area size on the treemap) by current market value, different coloration strategies are used to emphasize distinct features of current holdings compare with previous period. As shown below.
-
Weights Change
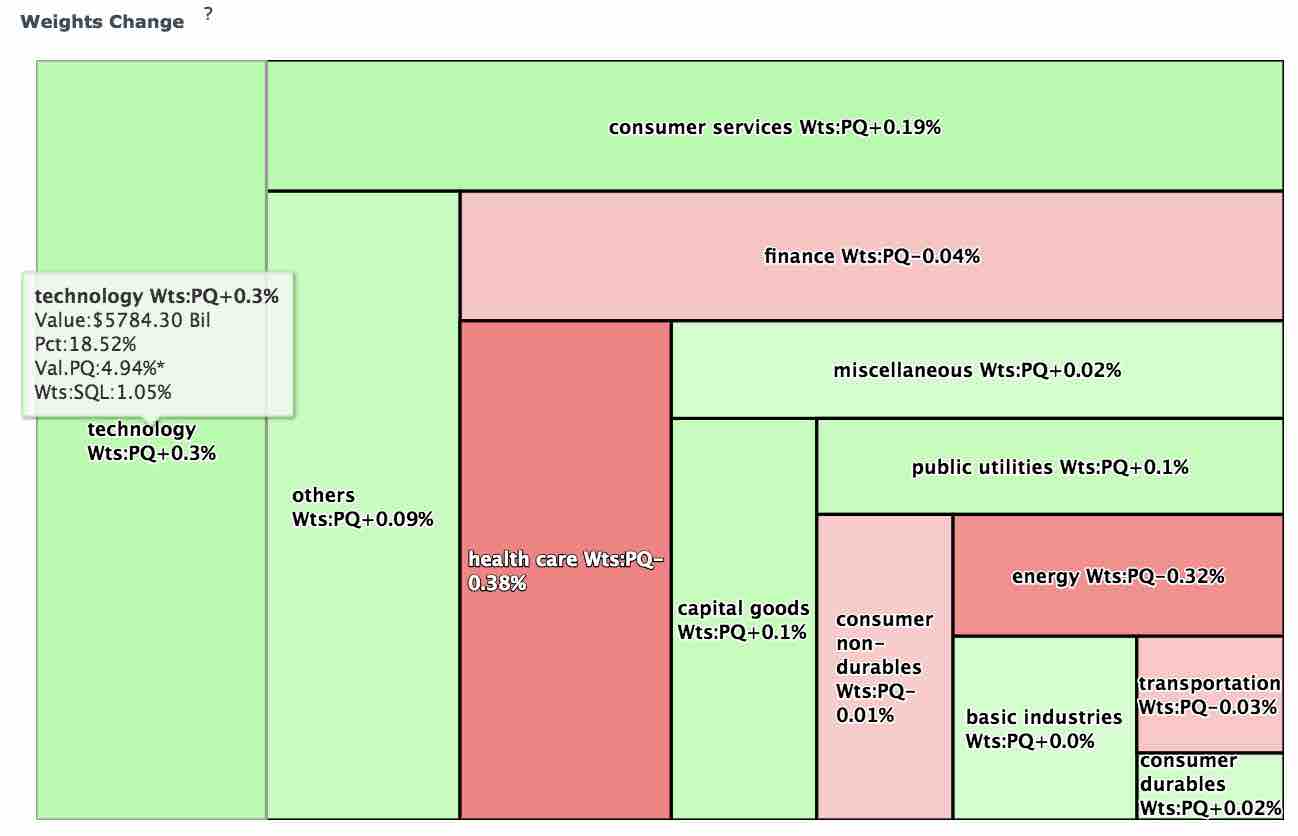
The sectors are colored by the change in weights (i.e. proportion of sector to whole market institutional holdings). A sector tile will be colored green if there is an increase in weights, or red if there is a decrease. It is noteworthy that the change in weights reflects overall effect of market appreciation/depreciation of share prices as well as acquisition/disposition at the discretion of portfolio managers.
In the above example, the "technology" sector has an institutional holding of $5.784 trillion, which accounts for 18.52% (i.e. weights) of all reported institutional holdings on the whole US market. This weights is 0.3 units more than previous period (18.22%), and 1.05 units more than same quarter last year (17.47%). The reported holding value ($5.784 trillion) is 4.94% higher than previous period* -
Acquisition/Disposition Percentage of Capital
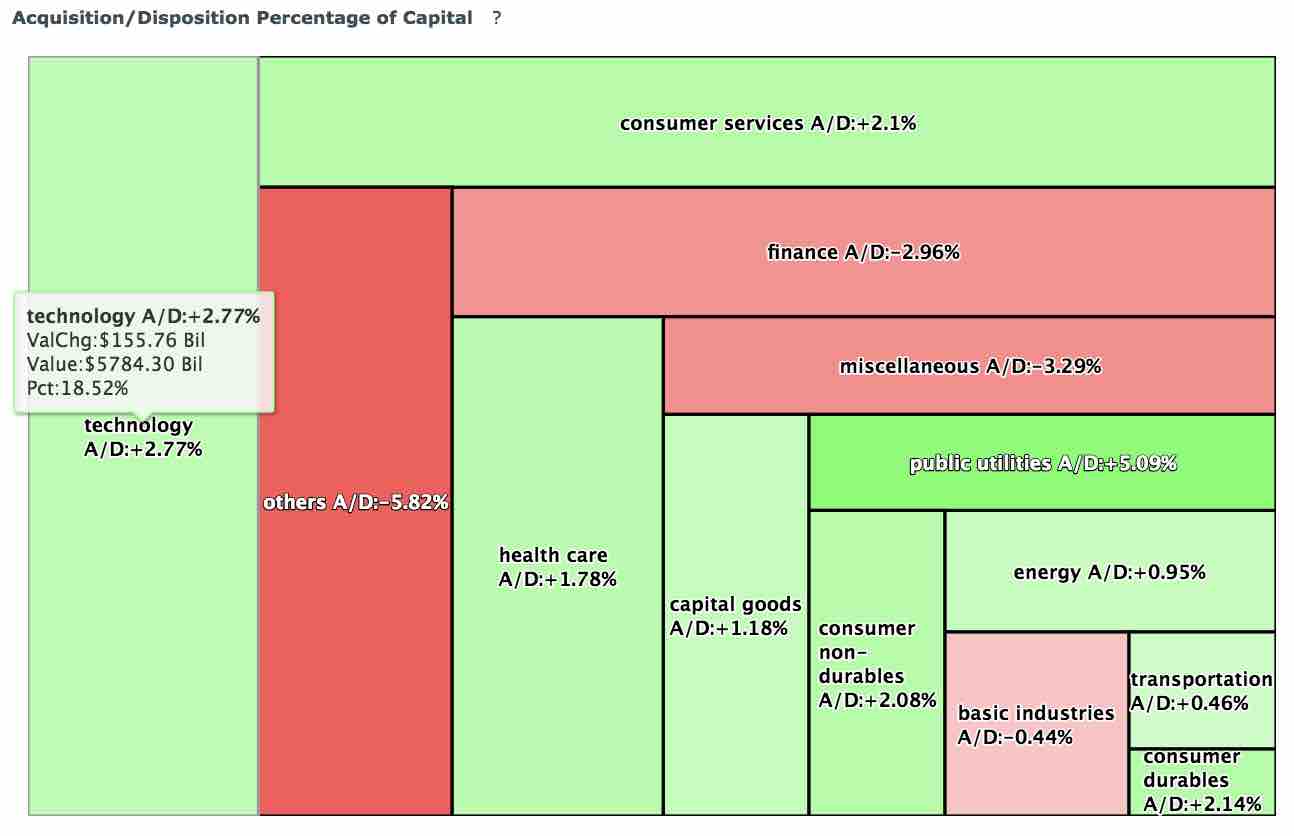
The sectors are colored by the overall acquisition/disposition dollar amount calculated from changes in shares amount multiplying deduced per share price. A sector tile will be colored green if there is an overall capital inflow, or red if there is an outflow. It is noteworthy that the change largely reflects the acquisition/disposition at the discretion of portfolio managers. In another word, there will be no change at all if there is no change in holding shares amount, regardless of any appreciation/depreciation of market price per share.
In the above example, the "technology" sector has a net capital inflow of $155.76 Billion, which accounts for 2.77% of total reported value of the sector (155.76/(5784.3 - 155.76) * 100%).It is noteworthy that weights change and capital flow do not necessarily have the same sign. For example, the "energy" sector has a negative weights change (-0.32%, and actually also a decrease in overall market value (-4.11% as of this writing)) but capital inflow (+0.95%).
The calculations are performed for the most recent period only when there are at least 500 Form 13F filings. Otherwise the panel will show statistics for the previous period. The threshold is set to ensure sufficient statistical power.
Industry Sentiment
Similar to sector sentiment but grouped by industry
* For the sector and industry level summarization, we do not provide coloration by percentage changes in holding values for the two reasons. First, the reported holding values change rapidly during filing season (i.e. within 45 days after each quarter end), which results in misleading presentation for a quite long period of time. Second, percentage changes in holding values are less meaningful unless all institution reports are available for current and previous period, which is almost not feasible due to late filings and confidential treatments.