


- Introduction
- Function Introduction
- Performance Monitor
- Fusion Hunter
- Quantitative Chart
- SEC Filing
- Insider Trading (Search by Ticker)
- Insider Trading (Search by Reporter)
- Insider Trading (Top Insider Trading)
- Institutional Holdings
- Investment Trends (Investment Company List)
- Investment Trends (Sector & Industry Sentiment)
- Investment Trends (Investment Company Sentiment)
- Investment Trends (Top Institutional Trading)
- Investment Trends (Top Institutional Hldg Change)
- Key Ratio Distribution
- Screener
- Financial Statement
- Key Metrics
- High Current Difference
- Low Current Difference
- Relative Strength Index
- KDJ
- Bollinger Bands
- Price Earnings Ratio
- Price to Book Value
- Debt Equity Ratio
- Leverage Ratio
- Return on Equity
- Return on Assets
- Gross Margin
- Net Profit Margin
- Operating Margin
- Income Growth
- Sales Growth
- Quick Ratio
- Current Ratio
- Interest Coverage
- Institutional Ownership
- Sector & Industry Classification
- Data Portal
- API
- SEC Forms
- Form 4
- Form 3
- Form 5
- CT ORDER
- Form 13F
- Form SC 13D
- Form SC 14D9
- Form SC 13G
- Form SC 13E1
- Form SC 13E3
- Form SC TO
- Form S-3D
- Form S-1
- Form F-1
- Form 8-k
- Form 1-E
- Form 144
- Form 20-F
- Form ARS
- Form 6-K
- Form 10-K
- Form 10-Q
- Form 10-KT
- Form 10-QT
- Form 11-K
- Form DEF 14A
- Form 10-D
- Form 13H
- Form 24F-2
- Form 15
- Form 25
- Form 40-F
- Form 424
- Form 425
- Form 8-A
- Form 8-M
- Form ADV-E
- Form ANNLRPT
- Form APP WD
- Form AW
- Form CB
- Form CORRESP
- Form DSTRBRPT
- Form EFFECT
- Form F-10
- Form F-3
- Form F-4
- Form F-6
- Form F-7
- Form F-9
- Form F-n
- Form X-17A-5
- Form F-X
- Form FWP
- Form G-405
- Form G-FIN
- Form MSD
- Form N-14
- Form N-18F1
- Form N-18F1
- Form N-30B-2
- Form N-54A
- Form N-8A
- Form N-CSR
- Form N-MFP
- Form N-PX
- Form N-Q
- Form TTW
- Form TA-1
- Form T-3
- Form SC 14F1
- Form SE
- Form SP 15D2
- Form SUPPL
- Form 10-12G
- Form 18-K
- Form SD
- Form STOP ORDER
- Form TH
- Form 1
- Form 19B-4(e)
- Form 40-APP
- Form 497
- Form ABS-15G
- Form DRS
- Form MA
- Form UNDER
- AI sentiment
- Access guide
- Academy
- Term of service
- GDPR compliance
- Contact Us
- Question Center
| Font Size: |
Debt Equity Ratio
Debt equity ratio measures the total liability (e.g. short + long term debt and associated interest) of a company relative to shareholder's equity. It is calculated through dividing total liability by shareholders' equity presented in consolidated balance sheet. A high ratio means the company is relying heavily on debt (i.e. borrow money) to make profit (if any), and a harder time to recover during economic downturn. While rarely seen, debt equity ratio can be negative when a company has negative equity (liability > assets), in which case the company will be hard to survive.
Similar to price earnings ratio, lower debt equity ratio is generally preferred when comparing two companies within the same industry, or sector*. Thus the inverse value (i.e. 1/debt equity ratio) is used to generate quantile ranking score [0~1]. Higher score (i.e. closer to 1) represents relatively lower debt equity ratio and better performance. Lower score (i.e. closer to 0) represents relatively higher debt equity ratio and poorer performance. Companies with negative debt equity ratio (due to negative equity) always have very low score, and have performance monitor shown in pink color to indicate that it is a negative value. However, there is no specific interpretation for negative debt equity ratio.
* large companies with good credit credential may have higher debt equity ratio than small companies. It should also be pointed out that an extemely low debt equity ratio may represent a company is not using leverage efficiently.
Debt equity ratio has industry and sector specific distribution (e.g. Utilities and financial companies generally have much higher debt equity ratio than industrial companies), so it only makes sense to compare debt equity ratio within the same industry, or sector. For comparing companies from different industries/sectors, it is more reasonable to compare their performances relative to corresponding industry/sector peers dictated by performance monitor.
Example 1: Approach Resources Inc. (NASDAQ:AREX), a Texas based small shell oil company, has debt equity ratio of 0.96 as of 2016-11-05. Denbury Resources Inc. (NYS:DNR), another Texas based shell oil company, has debt equity ratio of 4.69 at the same time
AREX Debt Equity Ratio: 0.96
|
DNR Debt Equity Ratio: 4.69
|
The debt equity ratio of AREX and DNR is better (lower) than 62% and 29% of industry peers, respectively. While at the whole market level, they are better than 63% and 26% of other companies
Historical Data
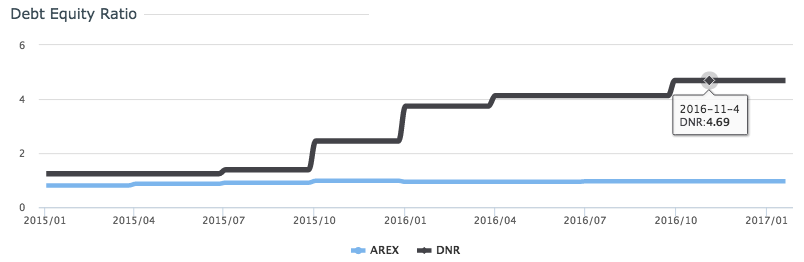
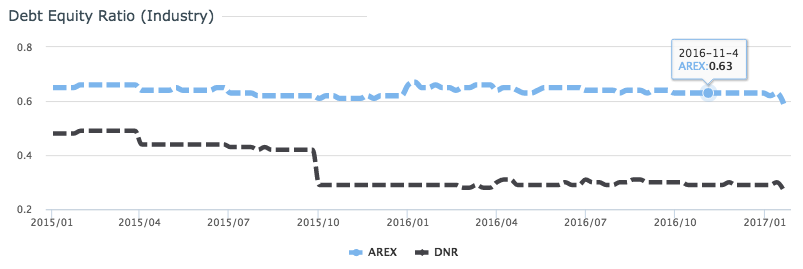
Analysis of historical data in the past 2 years indicates the debt equity ratio of DNR was constantly higher than AREX. The debt equity ratio of DNR was constantly higher than 1, and significant increased after Oct 2015. Note that debt equity ratio larger than 1 represents majority of assets are financed through debt. On the other hand, the performance of AREX relative to industry peers has no obvious change. The performance of DNR dropped significantly. Without considering other covariates, this single piece of information suggests AREX is a better choice than DNR at the time of writing.