


- Introduction
- Function Introduction
- Performance Monitor
- Fusion Hunter
- Quantitative Chart
- SEC Filing
- Insider Trading (Search by Ticker)
- Insider Trading (Search by Reporter)
- Insider Trading (Top Insider Trading)
- Institutional Holdings
- Investment Trends (Investment Company List)
- Investment Trends (Sector & Industry Sentiment)
- Investment Trends (Investment Company Sentiment)
- Investment Trends (Top Institutional Trading)
- Investment Trends (Top Institutional Hldg Change)
- Key Ratio Distribution
- Screener
- Financial Statement
- Key Metrics
- High Current Difference
- Low Current Difference
- Relative Strength Index
- KDJ
- Bollinger Bands
- Price Earnings Ratio
- Price to Book Value
- Debt Equity Ratio
- Leverage Ratio
- Return on Equity
- Return on Assets
- Gross Margin
- Net Profit Margin
- Operating Margin
- Income Growth
- Sales Growth
- Quick Ratio
- Current Ratio
- Interest Coverage
- Institutional Ownership
- Sector & Industry Classification
- Data Portal
- API
- SEC Forms
- Form 4
- Form 3
- Form 5
- CT ORDER
- Form 13F
- Form SC 13D
- Form SC 14D9
- Form SC 13G
- Form SC 13E1
- Form SC 13E3
- Form SC TO
- Form S-3D
- Form S-1
- Form F-1
- Form 8-k
- Form 1-E
- Form 144
- Form 20-F
- Form ARS
- Form 6-K
- Form 10-K
- Form 10-Q
- Form 10-KT
- Form 10-QT
- Form 11-K
- Form DEF 14A
- Form 10-D
- Form 13H
- Form 24F-2
- Form 15
- Form 25
- Form 40-F
- Form 424
- Form 425
- Form 8-A
- Form 8-M
- Form ADV-E
- Form ANNLRPT
- Form APP WD
- Form AW
- Form CB
- Form CORRESP
- Form DSTRBRPT
- Form EFFECT
- Form F-10
- Form F-3
- Form F-4
- Form F-6
- Form F-7
- Form F-9
- Form F-n
- Form X-17A-5
- Form F-X
- Form FWP
- Form G-405
- Form G-FIN
- Form MSD
- Form N-14
- Form N-18F1
- Form N-18F1
- Form N-30B-2
- Form N-54A
- Form N-8A
- Form N-CSR
- Form N-MFP
- Form N-PX
- Form N-Q
- Form TTW
- Form TA-1
- Form T-3
- Form SC 14F1
- Form SE
- Form SP 15D2
- Form SUPPL
- Form 10-12G
- Form 18-K
- Form SD
- Form STOP ORDER
- Form TH
- Form 1
- Form 19B-4(e)
- Form 40-APP
- Form 497
- Form ABS-15G
- Form DRS
- Form MA
- Form UNDER
- AI sentiment
- Access guide
- Academy
- Term of service
- GDPR compliance
- Contact Us
- Question Center
| Font Size: |
Fusion Hunter
Fusion hunter focuses on screening of technical crossovers, non-crossover approach, and commonly used technical indicators. It is recommended for swing/position traders, or short to medium term investors. While fundamental indicators are also available for screening in this module, we recommend to perform fundamental screening in Screener.
The webpage is composed of three main components shown below
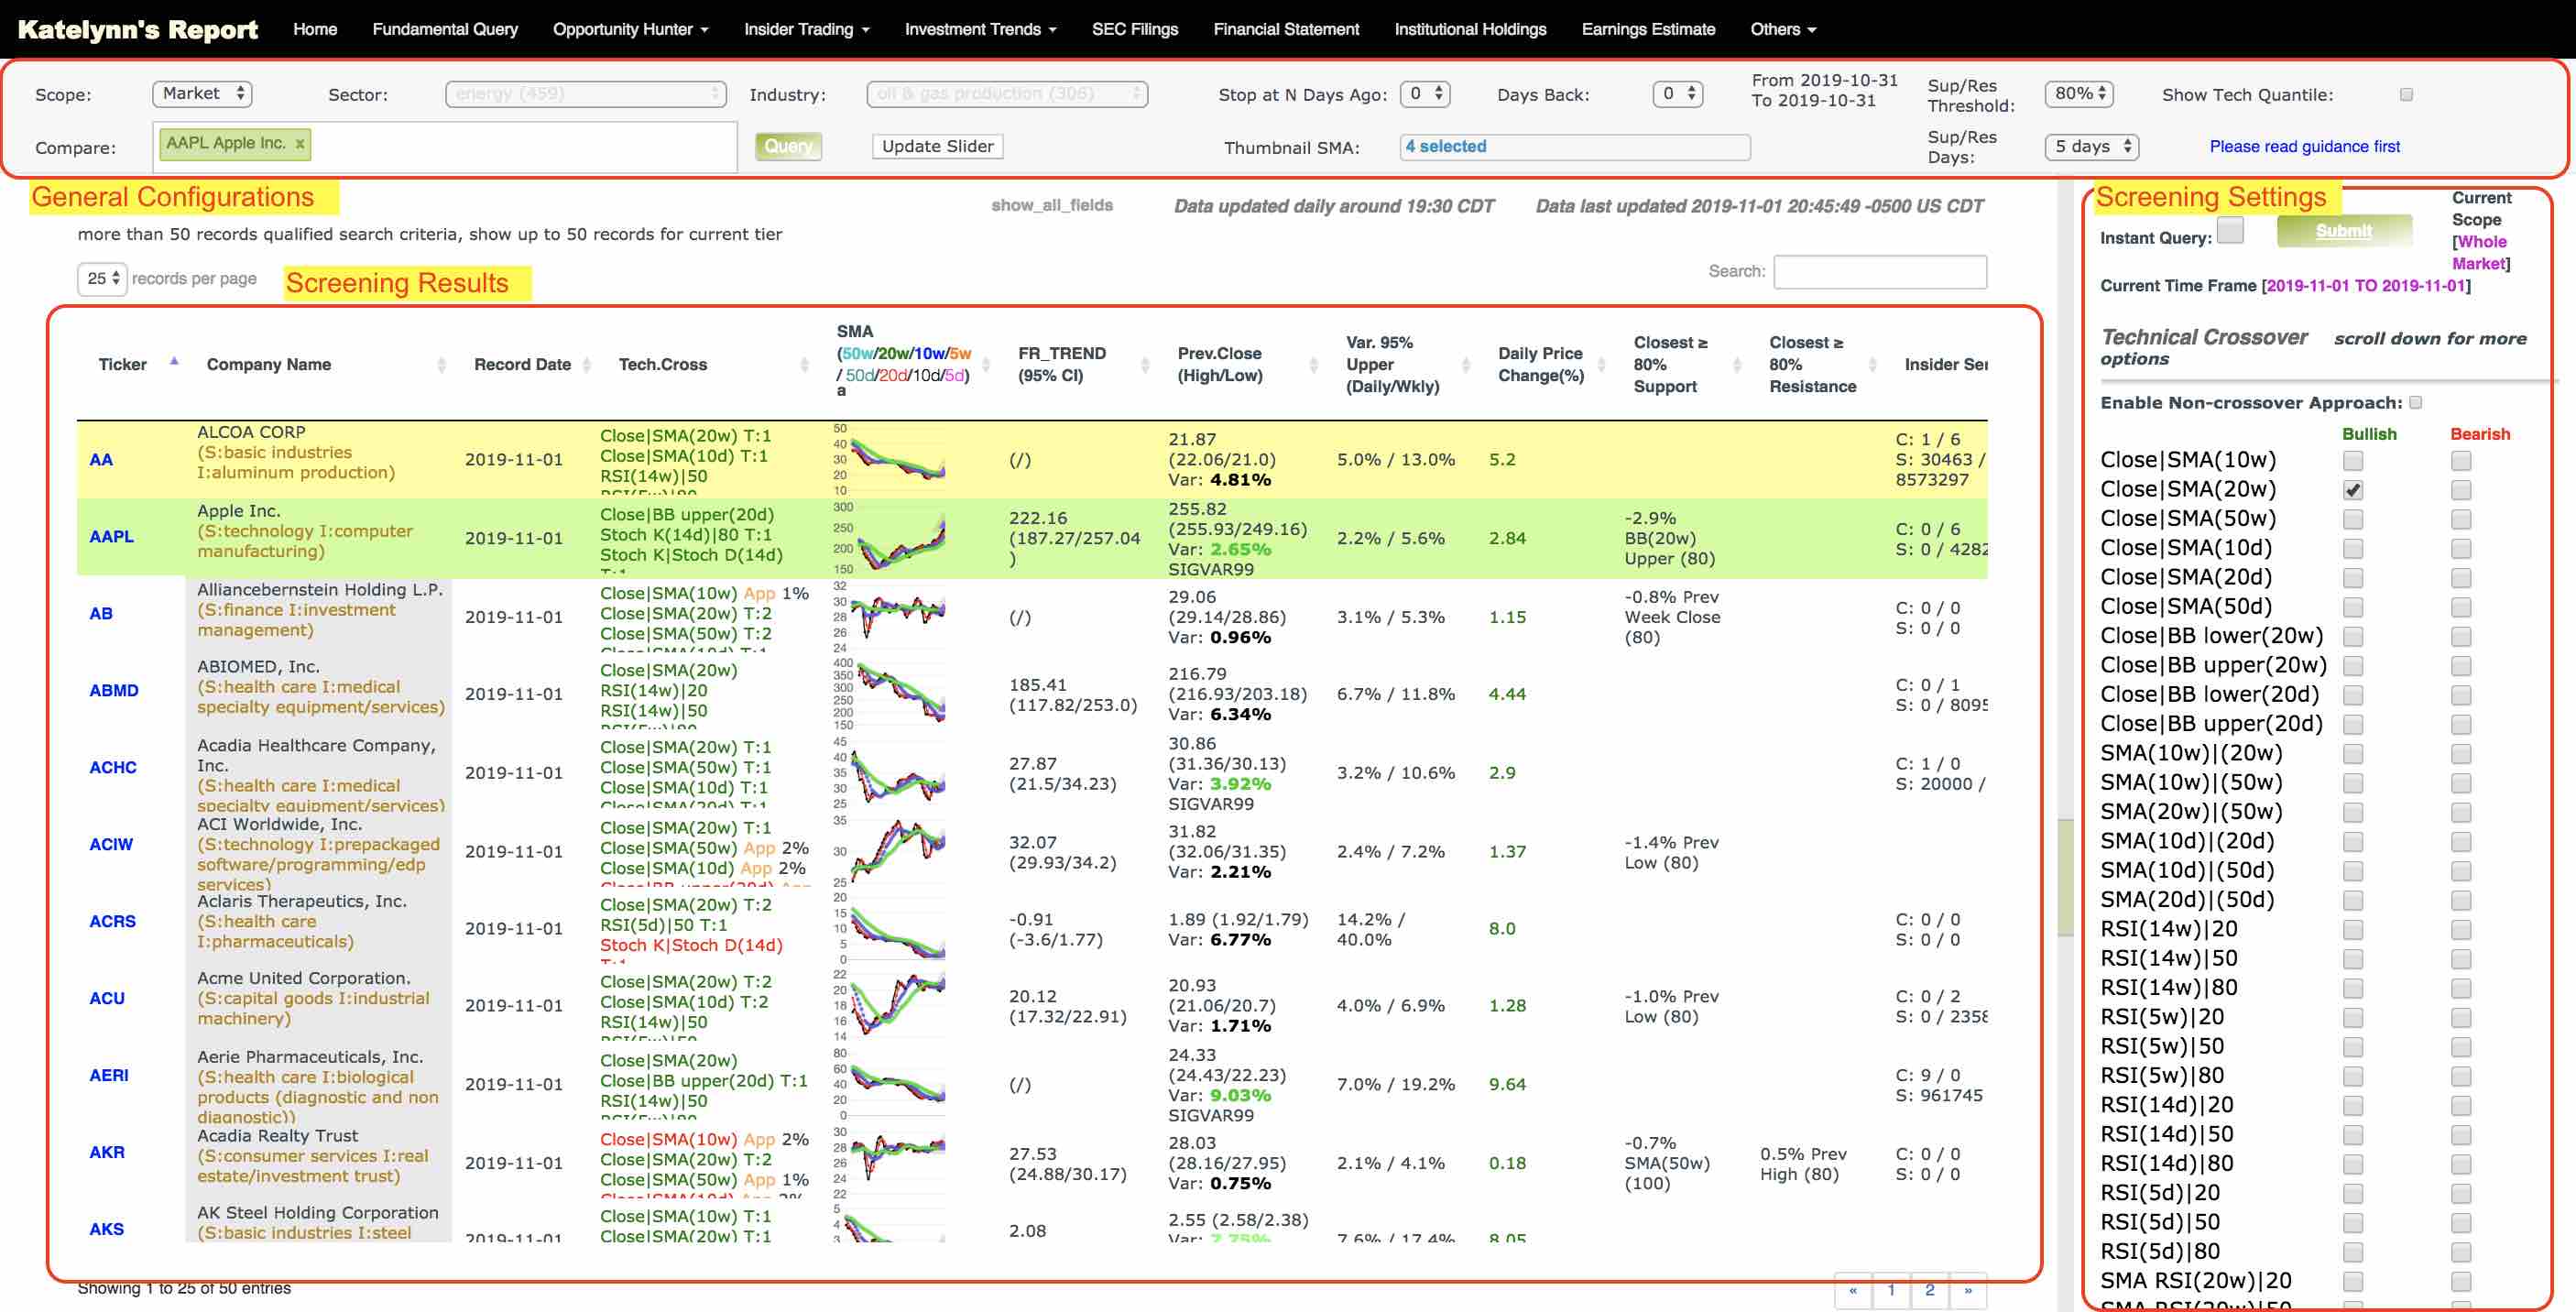
General Configurations
Scope/Sector/Industry: Define the scope of your search. The default value is the whole US stock market. You can also set search scope to specific sector or industry. If there is a change in scope, remember to click 'Update Slider' button before using any function(s) in east panel.
Stop at N Days Ago: Query historical records of N day(s) ago. The result will not include results from today to N-1 days ago. E.g. if today is 2019-05-10, set this number to 3 will enable search of data recorded on 2019-05-07 and skip dates from 2019-05-08 to 2019-05-10.
Days Back: The search will span X days. E.g. if today is 2019-05-10, set this number to 3 will enable search from 2019-05-07 to 2019-05-10.
Tips: Your search time frame is reflected immediately on the right side and shown as "From XXXX-XX-XX to XXXX-XX-XX".
Sup/Res Threshold: The percentage threshold to determine the closest support/resistance levels. For example, setting this value to 80% will show the closest ≥80% support level in the result table. Recommend threshold is 80%.
Sup/Res Days: The number of trading days used to calculate Sup/Res Threshold. For example, set this value to 5 days will calculate Sup/Res Threshold based on last 5 trading days.
Update Slider: Updates the range sliders in the east panel to match the search scope and time frame. This button must be clicked manually if there is any change(s) in search scope (i.e scope/sector/industry) or time frame (i.e. Stop at N Days Ago/Days Back). As a reminder, the button will flash three times and end with yellow background. It will restore normal background after being clicked. Please wait a few seconds for the server to update the slider information. However, if you are not going to use any function(s) in east panel, you don't have to click 'Update Slider' button.
Compare: Compare up to 8 symbols, which will be forced to be shown in the screening results. Note that east panel does not submit this parameter, which needs to be submitted by "Query" button, as explained below.
Query: Force query ticker(s) appeared in the compare box and show results (together with other tickers that qualified the search criteria) in the results table. The force included records are shown in green background color. You can query up to 8 (tier ≥ 1) or 2 (guest or tier 0) tickers in one time.
Show Tech Quantile: Whether show quantile pie chart of technical indicators. Note that east panel will submit this parameter.
Thumbnail SMA: The simple moving average that will be shown in the thumbnail charts. Note that east panel will submit this parameter.
Screening Settings
Instant Query: When this is checked, the search will start immediately when there is any change in the technical crossover checkbox, or technical/fundamental range sliders. The "Submit" button will be hidden when this is checked.
Current Scope: A string indicates the current scope of search. E.g. "Whole Market" for whole market search. "Sector: Energy" for search only in the energy sector.
Available screening options
The screening options are grouped into three categories including technical crossovers, technical indicators, and fundamental indicators. In practice, the three categories work together to give the final screening results.
Technical Crossovers: Select either bullish (left parameter cross from below to above right parameter) or bearish (left parameter cross from above to below right parameter) crossover. Note that you can not select both at the same time.
Technical Indicators: Include indictors with either daily (updated daily) or weekly (updated weekly) feature. E.g. Relative Strength Index (w/14) is 14-week RSI, Relative Strength Index (d/14) is 14-day RSI. There are about 30 technical indicators to tune. Most indicators are tuned with regular slider(i.e. the scale on the ruler represents the original value). For certain indicators which we think the original values are less meaningful and hard to be used directly (e.g. Bollinger Bands Width), quantile sliders are used.
Example:
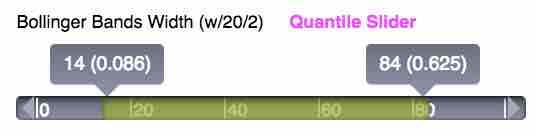
Here the scale of the ruler ranges from 0 to 100, which represents the lowest quantile(0th) to the highest quantile(100th) of BBW in current search scope. In this example, we are interested in stocks in the whole US market with BBW between 14th and 84th quantile, which corresponds to BBW value 0.086 and 0.625, as shown in parentheses.
Here is a brief introduction of several commonly used technical indicators
-
SMA RSI
Relative strength index for simple moving average monitors the overall trend of moving average. RSI is calculated using 14 periods data for four different levels of moving average (20-week, 10-week, 20-day, 10-day). -
Stochastic Oscillator (KDJ) Slow
KDJ is the most widely used technical indicator that uses support and resistence levels to monitor potential turning points of stock price. Please read KDJ for more details about KDJ. "Fusion Hunter" currently provides 14 periods daily and 9 periods weekly KDJ slow for statistical screening.
Tips and Recommendations
K: Consider a long position when K crosses above 20, and above D line. Watch out for premature signal (e.g K = 19.5), or K crosses back below 20 after crossing above 20, in both cases significant downturns might be ahead.
D: When D line is below K line, it is a bullish signal. When D line is above K line, it is a bearish signal.
J: High J value is a bullish signal, and may also indicate overbought. Low J value is a bearish signal, and may also indicate oversold.
K - D: use to filter the records with K larger than or smaller than D. -
Bollinger Bands (BB)
BB is widely used to measure the volatility of stock price. It works by defining a range (formed by an upper band and a lower band) between which stock price is most likely to fluctuate. Please read Bollinger Bands for more details about BB and several technical indicators derived from BB. "Fusion Hunter" currently provides 20 periods (both daily and weekly) BB with 2 standard deviations (the most popular configurations) for statistical screening.Tips and Recommendations
BBW (Bollinger Bands Width): the width of BB is proportional to the volatility of stock. Smaller BBW (i.e. lower BB quantile score) represents less volatility. Investors who prefer large price movement should consider stocks with high BBW.
BBC (Bollinger Bands Constrain): BBC larger than 1 indicates BBW breakout, while less than 1 indicates BBW squeeze. When a stock starts to squeeze, less volatility should be anticipated. Upward breakout happens when BBC is larger than 1, and price moves alone the upper band. Downward breakout happens when BBC is larger than 1, and price moves along the lower band. For taking long positions, we generally recommend to consider stocks that just start to breakout alone the upper band. BBC should be used with other indicators to facilitate decision making.
BBP (Bollinger Bands Percentage, or BB %b): price is closer to upper band when BBP is higher than 50%. BBP can be used with BBC to determine the direction of BB breakout. - Relative Strength Index (RSI)
RSI is used to determine the strength or weakness of stock in specific periods. Please read Relative Strength Index for more details about RSI. "Fusion Hunter" currently provides 5 and 14 periods daily and weekly Cutler's RSI for statistical screening. More RSI options are available for display in the Technical Charts
Tips and Recommendations
The configurations for RSI are discussed in detail in the Best Practice section of "Screener" webpage. -
High/Low - Current Difference (HCD and LCD)
HCD(or LCD) monitors how far current price is away from 52-week High(or Low). Please read HCD, LCD for more details. Note that HCD and LCD are updated daily in "Fusion Hunter" (compare with weekly update in the "Screener" webpage).Tips and Recommendations
Watch out for stocks at or close to one year high or low. A stock at its one year peak (small HCD) is very likey overbought, which under most circumstances means you have missed the best entry point. On the other hand, there must be some reasons for a stock to plunge to one year low (high LCD). Nobody except the market knows where the bottom is.
About data update time: For the screening function (i.e. the sliders shown on the right panel of "Fusion Hunter"), to avoid premature trading signal caused by incomplete weekly data, weekly technical indicators are updated only weekly (i.e. after the end of the last trading day of each week). However, users can still have a peek into the weekly technical indicators for an incomplete week through the weekly Technical Charts, which calculates daily and weekly indicators on the fly and are updated daily.
Fundamental Indicators: Fundamental indicators are updated weekly (typically on Sunday morning). There are about 30 fundamental indicators to tune. In practice, fundamental indicators are not frequently used in this module. However, some operations like set minimum assets/revenue threshold are still recommended.
Enable Non-crossover Approach: When this is checked, the search will be for non-crossover approach (E.g. close price is above SMA20w (20-week SMA) both yesterday and today, and is within 1% range of SMA20w today. In another word, the close price is approaching SMA20w from above without crossing SMA20w line). The headers "Bullish" and "Bearish" will change to "From Above" and "From Below". Currently only close price related parameters support non-crossover approach, so other parameters (e.g. SMA(10w)|(20w)) will be disabled.
There are two ranges available for selection (0 ≤ x < 1%) and (1% ≤ x < 2%). Select both will enable a wider range (i.e. 0 ≤ x < 2%). Note that x = 0 represents the scenario that left parameter is exactly the same as right parameter.
Screening Results
The screening results represent a combined effect of technical crossovers, technical indicators, and fundamental indicators.
Hide Column: Mouse over the header to show the hide column "<<" link (see below).
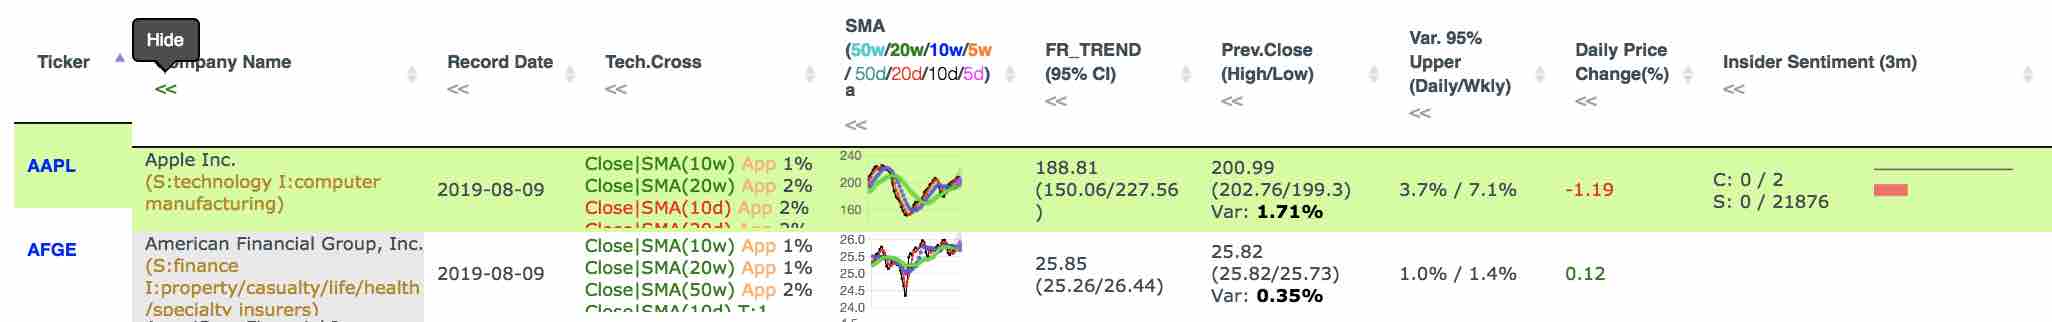
Click the link will hide corresponding column. A "show_all_fields" link will become visible above the results table. Mouse over the link to show a list of columns that are currently hidden. Note that your column display preference (as well as all other settings) will be recorded by our server, so you don't have to do the same configuration everytime.
Search: Instant search of all records in the results table. For example, type string "S:technology" into the search box can instantly narrow down the results to stocks in technology sector.
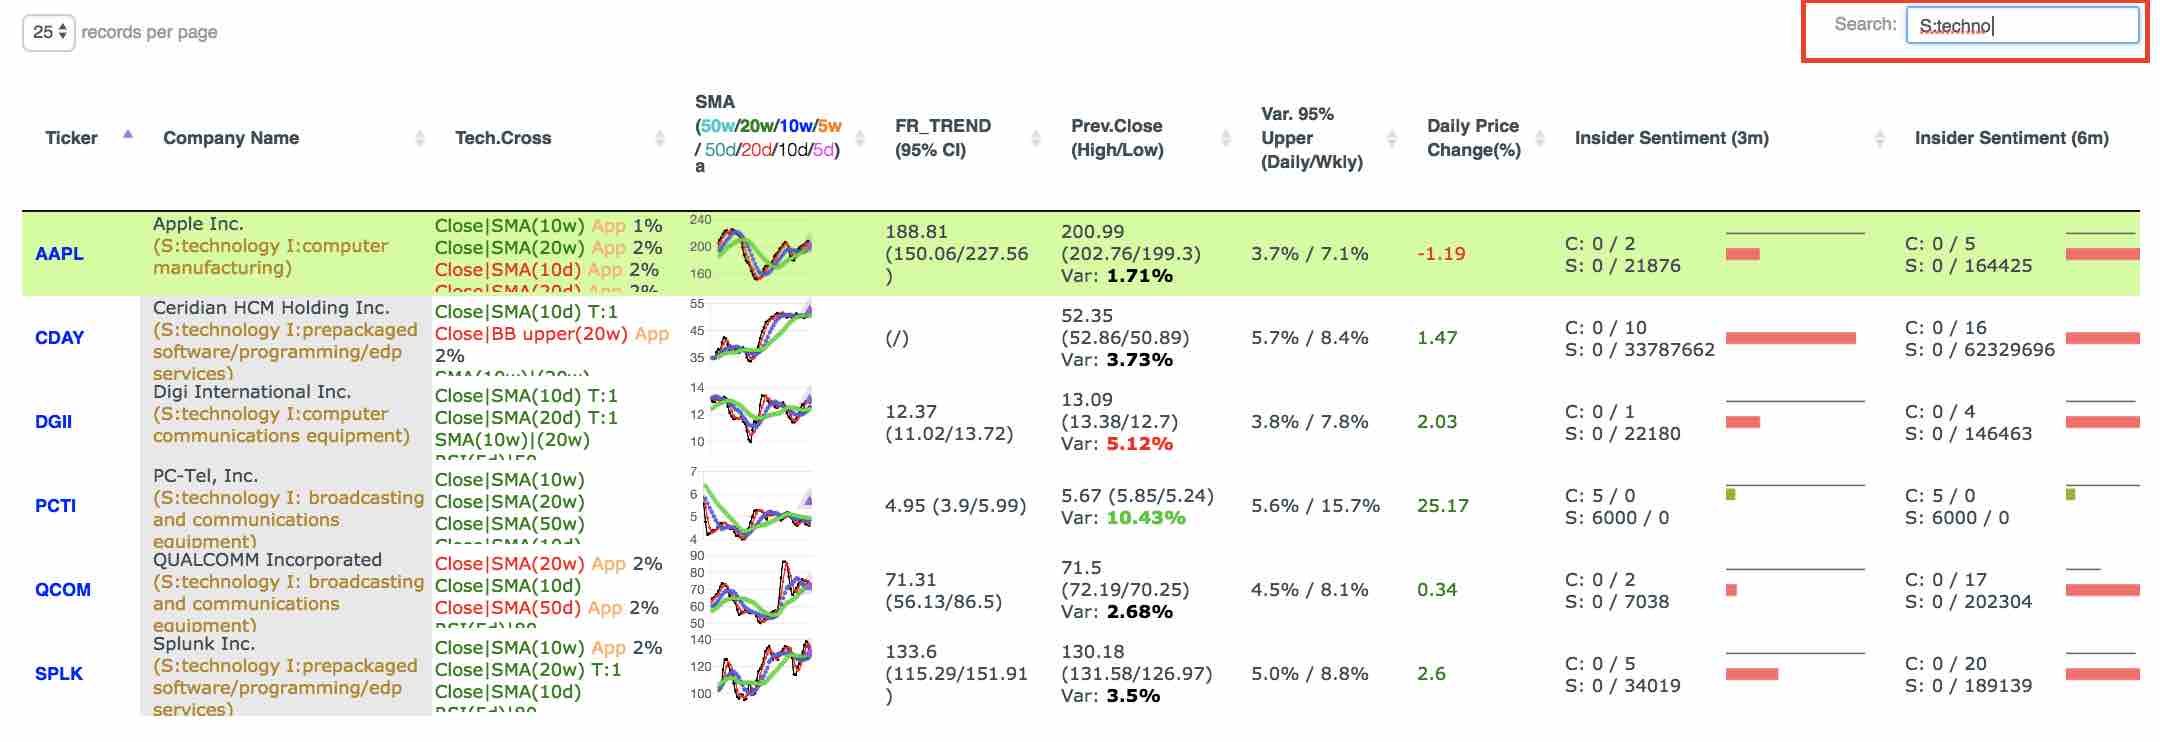
Note that instant search is applied only to the records that are already included in the results table (up to 50 records currently). Thus in order to get a relatively comprehensive list of qualififed stocks in, say, technology sector, you have to follow workflow "select scope"->"update slider"->"submit".
Tips: type "SIGVAR", "SIGVAR95", or "SIGVAR99" to narrow down results to significance price variation.
Ticker: The trading symbol of stock. Click on any ticker will open its quantitative analysis page in a new window.
Company Name: Full name of the company, following by (S:sector I:industry).
Record Date: The latest date when the ticker matches your search criteria. This is useful only when historical search is enabled (i.e. Stop at N Days Ago or Days Back > 0), in which case the date may not be the last trading day. In historical search, most fields reflect data of corresponding 'Record Date', except SMA thumbnail, FR_TREND, price variation, Var.95% Upper, Insider/Institutional Sentiment, which always show information as of the last trading day.
Tech.Cross Technical crossover and non-crossover approach of 'Record Date'. Green color represents bullish crossover (or approach from above). Red color represents bearish crossover (or approach from below). String followed with "App 1%" represents non-crossover approach within 1% range of target line (i.e. right parameter). Mouse over corresponding record to enlarge.
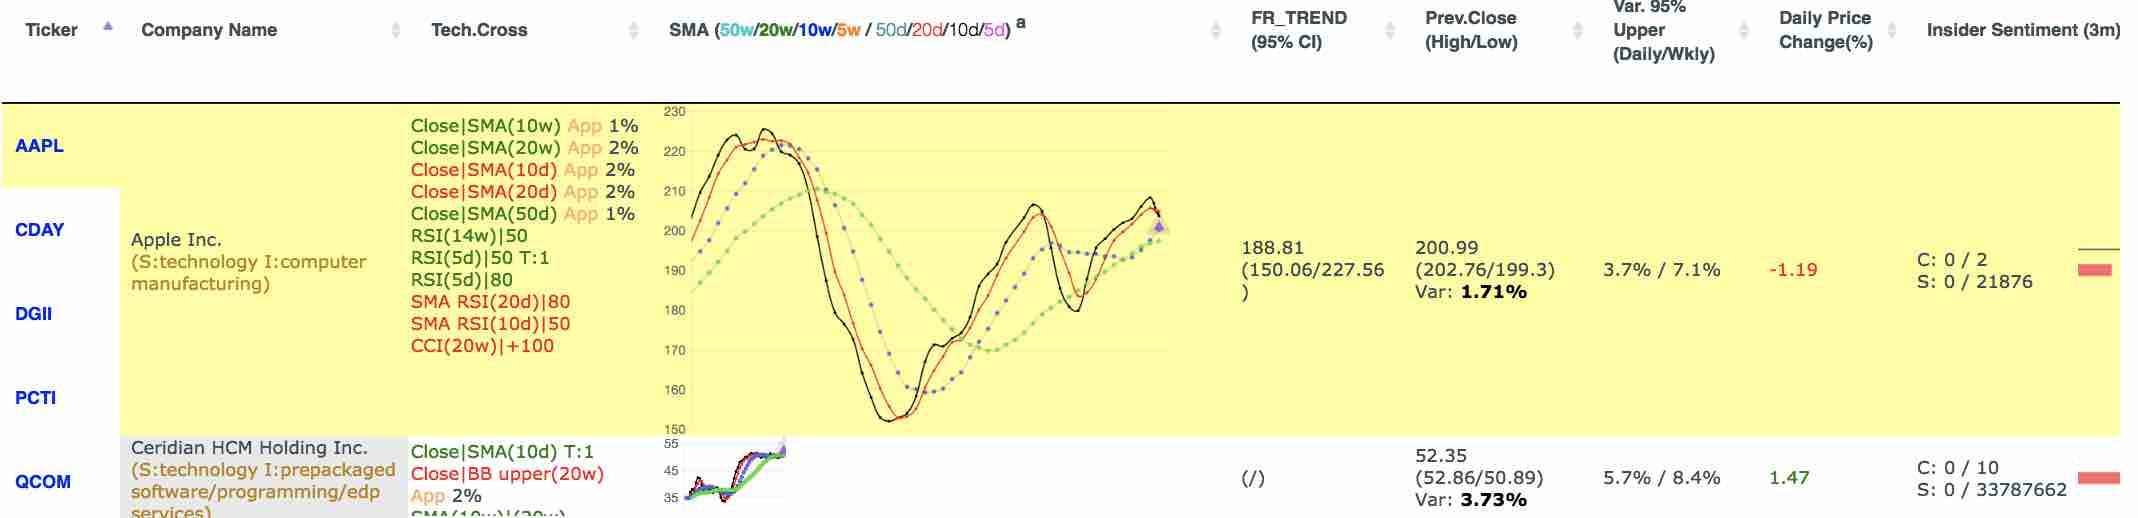
SMA: Simple moving average thumbnail chart as of the last trading day. Eight levels (50w/20w/10w/5w / 50d/20d/10d/5d) of SMA are available (configure through "thumbnail SMA" option in navigation panel). The purple triangle denotes close price of the last trading day. Mouse over corresponding record to enlarge.
FR_TREND: Fundamental regression with time series trend and 95% confidence interval as of the last trading day. Check Quantitative Analysis for details.
Prev.Close(High/Low): Close and high/low prices of 'Record Date', followed by the lastest 10-day price variation. The variation is shown in light/dark (green/red) color to indicate significant price variation at p<0.05 or p<0.01 level. The green/red color indicates close price higher/lower than open price.
Var 95%(Daily/Weekly): Upper boundary of 95% confidence interval of the latest 10-period daily/weekly price variation. When price variation of previous trading day is greater than this value, it is considered statistically significant.
Closest >x% Support: The difference between closest x% support level and previous close price. This value is mostly negative, but can be positive when close price dropped below closest >x% support level.
Closest >x% Resistance: The difference between closest x% resistance level and previous close price. This value is mostly positive, but can be negative when close price crossed above closest >x% resistance level.
Insider Sentiment(3m/6m): The acq/dsp count(C:) and shares amount(S:) of vital&spontaneous insider transactions in the last 3 and 6 months as of the last trading day.
For acquisitions, code P (open market purchase), L (small acquisition), and I (at discretion of broker) are counted. For dispositions, code S (open market sell), D (sell back to issuer) and I (at discretion of broker) are counted. "C:" count of number of transactions. "S:" shares amount involved in corrresponding transactions.
The chart illustrates shares amount. The thin black bar is a constant size ruler for easy comparison.
Institution Sentiment(current period/last period): The acq/dsp count(C:) and shares amount(S:) of institutional holders in corresponding quarter.
dark green: new holdings
light green: adding more shares
dark red: sold out
light red: reducing shares
Other Technical Indicators: All other indicators reflect information of 'Record Date'. Daily indicators have white background and are updated daily. Weekly indicators have orange background and are updated weekly.
Best Practice
Scenario 1: Screening the whole US market for eligible stocks on the last trading day
[Use default scope (Market)]-->[configure east panel to meet your requirement]-->[click "Submit"]
Scenario 2: Screening the whole US market for eligible stocks in the past 4 days on and before the last trading day
[Use defaule scope (Market)]-->[set 'Days Back' to 4]-->[click 'Update Slider']-->[configure east panel to meet your requirement]-->[click "Submit"]
If you want to use the existing settings in east panel, the update slider and submit steps are not necessary
[Use defaule scope (Market)]-->[set 'Days Back' to 4]-->[click 'Query']
Scenario 3: Screening energy sector for eligible stocks on the last trading day
[Set 'Scope' to 'Sector']-->[set 'Sector' to 'energy']-->[click 'Update Slider']-->[configure east panel to meet your requirement]-->[click "Submit"]
If you want to use the existing settings in east panel, the update slider and submit steps are not necessary
[Set 'Scope' to 'Sector']-->[set 'Sector' to 'energy']-->[click 'Query']
Scenario 4: Screening oil and gas production industry for eligible stocks in the past 4 days on and before the last trading day
[Set 'Scope' to 'Industry']-->[set 'Industry' to 'oil & gas production']-->[set 'Days Back' to 4]-->[click 'Update Slider']-->[configure east panel to meet your requirement]-->[click "Submit"]
If you want to use the existing settings in east panel, the update slider and submit steps are not necessary
[Set 'Scope' to 'Industry']-->[set 'Industry' to 'oil & gas production']-->[set 'Days Back' to 4]-->[click 'Query']
Scenario 5: Add 50-week SMA to thumbnail charts, others unchanged
Route 1: [Check 'SMA(50w)' in 'Thumbnail SMA']-->[click 'Query']
Route 2: [Check 'SMA(50w)' in 'Thumbnail SMA']-->[click 'Submit']
Scenario 6: Screening energy sector for eligible stocks on the last trading day, add 50-week SMA to thumbnail charts, screening for stocks with close price cross above 10-week SMA
[Set 'Scope' to 'Sector']-->[set 'Sector' to 'energy']-->[Check 'SMA(50w)' in 'Thumbnail SMA']-->[click 'Update Slider']-->[check 'Bullish' check box of 'Close|SMA(10w)']-->[click 'Submit']