


- Introduction
- Function Introduction
- Performance Monitor
- Fusion Hunter
- Quantitative Chart
- SEC Filing
- Insider Trading (Search by Ticker)
- Insider Trading (Search by Reporter)
- Insider Trading (Top Insider Trading)
- Institutional Holdings
- Investment Trends (Investment Company List)
- Investment Trends (Sector & Industry Sentiment)
- Investment Trends (Investment Company Sentiment)
- Investment Trends (Top Institutional Trading)
- Investment Trends (Top Institutional Hldg Change)
- Key Ratio Distribution
- Screener
- Financial Statement
- Key Metrics
- High Current Difference
- Low Current Difference
- Relative Strength Index
- KDJ
- Bollinger Bands
- Price Earnings Ratio
- Price to Book Value
- Debt Equity Ratio
- Leverage Ratio
- Return on Equity
- Return on Assets
- Gross Margin
- Net Profit Margin
- Operating Margin
- Income Growth
- Sales Growth
- Quick Ratio
- Current Ratio
- Interest Coverage
- Institutional Ownership
- Sector & Industry Classification
- Data Portal
- API
- SEC Forms
- Form 4
- Form 3
- Form 5
- CT ORDER
- Form 13F
- Form SC 13D
- Form SC 14D9
- Form SC 13G
- Form SC 13E1
- Form SC 13E3
- Form SC TO
- Form S-3D
- Form S-1
- Form F-1
- Form 8-k
- Form 1-E
- Form 144
- Form 20-F
- Form ARS
- Form 6-K
- Form 10-K
- Form 10-Q
- Form 10-KT
- Form 10-QT
- Form 11-K
- Form DEF 14A
- Form 10-D
- Form 13H
- Form 24F-2
- Form 15
- Form 25
- Form 40-F
- Form 424
- Form 425
- Form 8-A
- Form 8-M
- Form ADV-E
- Form ANNLRPT
- Form APP WD
- Form AW
- Form CB
- Form CORRESP
- Form DSTRBRPT
- Form EFFECT
- Form F-10
- Form F-3
- Form F-4
- Form F-6
- Form F-7
- Form F-9
- Form F-n
- Form X-17A-5
- Form F-X
- Form FWP
- Form G-405
- Form G-FIN
- Form MSD
- Form N-14
- Form N-18F1
- Form N-18F1
- Form N-30B-2
- Form N-54A
- Form N-8A
- Form N-CSR
- Form N-MFP
- Form N-PX
- Form N-Q
- Form TTW
- Form TA-1
- Form T-3
- Form SC 14F1
- Form SE
- Form SP 15D2
- Form SUPPL
- Form 10-12G
- Form 18-K
- Form SD
- Form STOP ORDER
- Form TH
- Form 1
- Form 19B-4(e)
- Form 40-APP
- Form 497
- Form ABS-15G
- Form DRS
- Form MA
- Form UNDER
- AI sentiment
- Access guide
- Academy
- Term of service
- GDPR compliance
- Contact Us
- Question Center
| Font Size: |
Investment Trends
Top Institutional Trading
This module monitors the stocks that have been most acquired/disposed by institutions in specific period. The summary statistics are based on Form 13F filings. The information is updated daily (workday only) around 5:30 AM US CDT.
Note this module is different from Top Institutional Hldg Change, which focuses on net changes (i.e. the overall effect of acquisitions and dispositions) in proportion of institutional holding to shares outstanding.
- Configurations
-
Consensus Institutional Trading
- Institutional Sentiment
Configurations
Scope/Sector/Industry: Define query scope. Default is the whole US stock market. You can set search scope to specific sector or industry.
Num Rec: The maximum number of records to be displayed in each result table.
Order By: Sort the query results in specific order, descendingly.
For example, order by "Num of Transaction Count" will display the stocks with larger number of acquisition transactions in the "Top Acquisition" table, and the stocks with larger number of disposition transactions in the "Top Disposition" table.
In the case of order by "Ratio of Acquisition/Disposition Count", the "Top Acquisition" table will show the stocks with larger ratio of acquisition to disposition count. The "Top Disposition" table will show the stocks with larger ratio of disposition to acquisition count. The same rule applies to other options.
Period: Show statistics for the latest period (default), or previous period. The data of previous period is useful when there are very few filings available for the latest period (e.g. in the first few days after each quarter end)。
Top Acquisition
The following image illustrates part of the search results by querying the whole US market and order by "Ratio of Acquisition/Disposition Count".
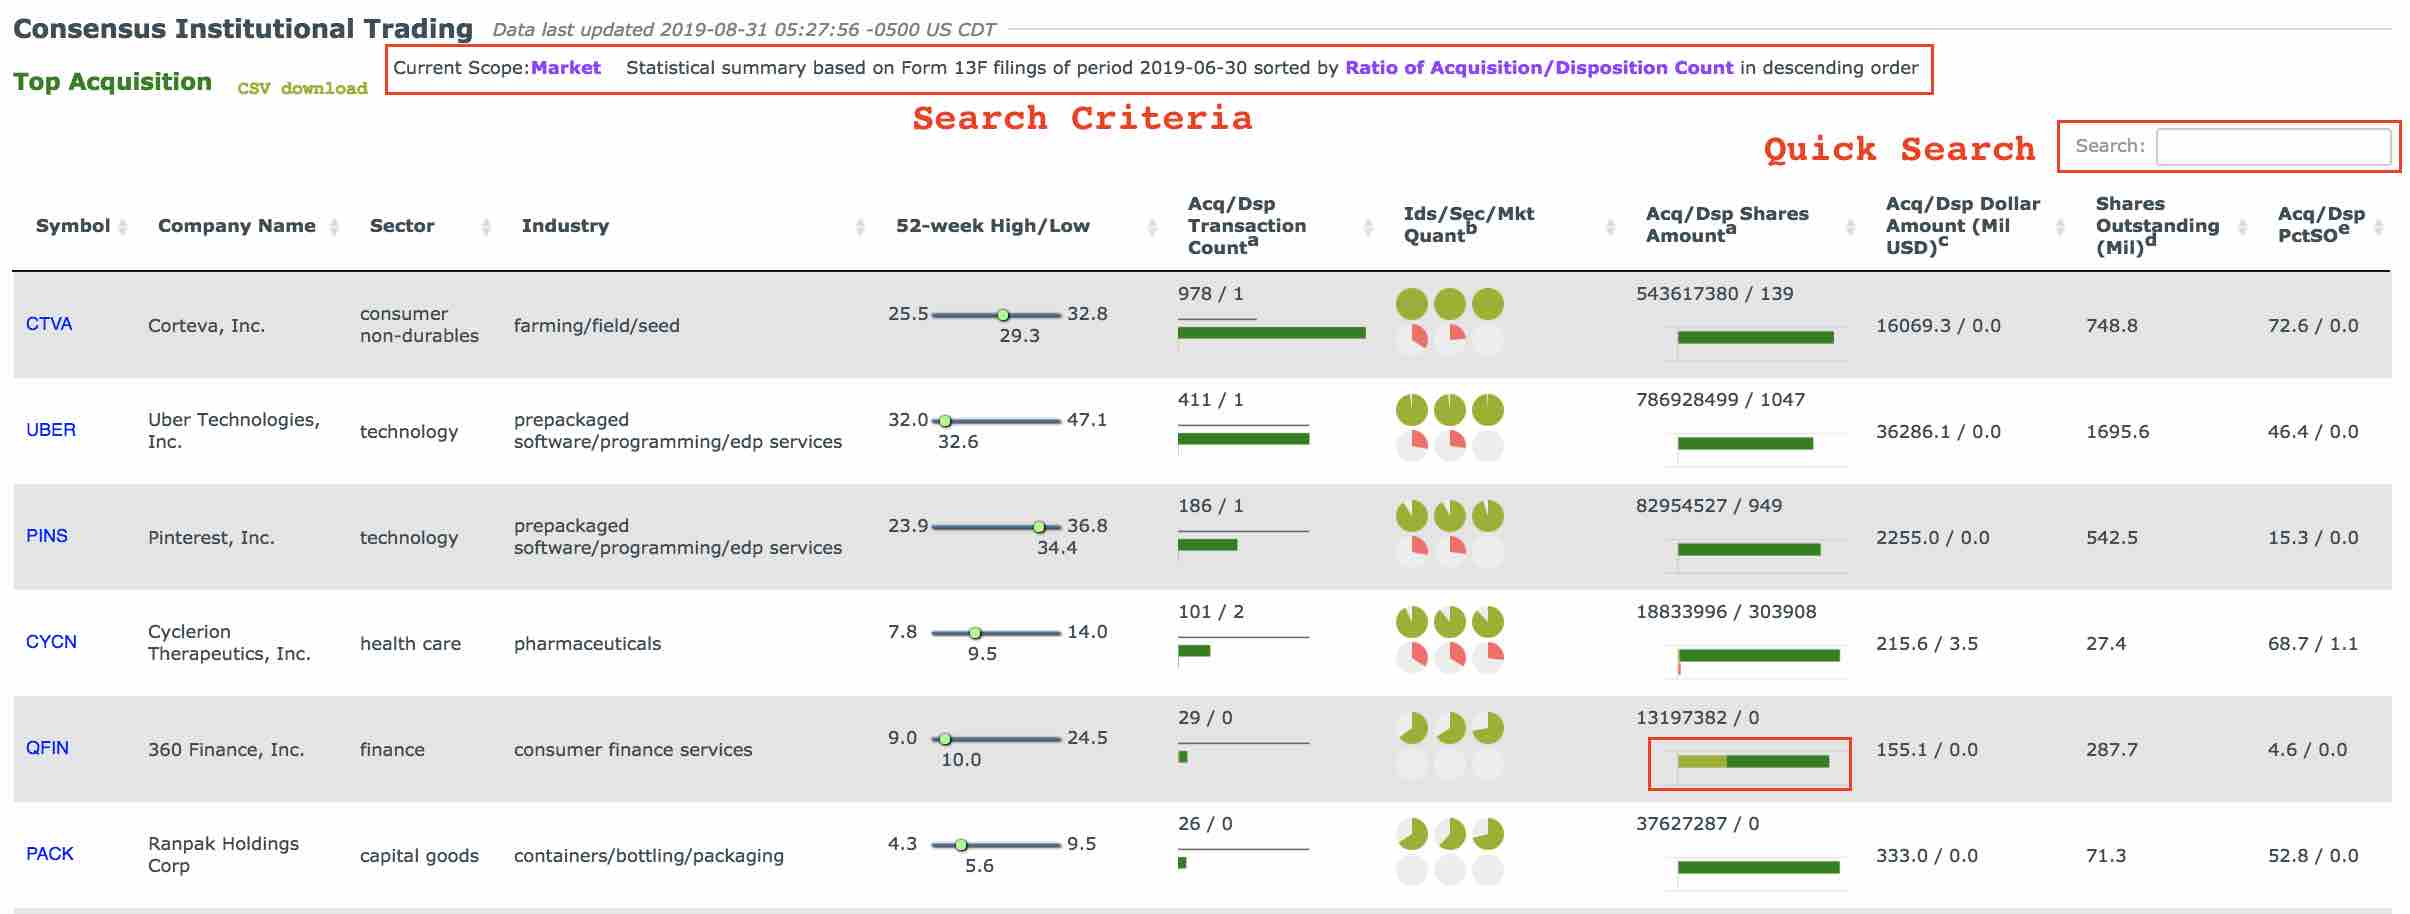
Quick Search: Type in any keyword (case insensitive) in the search box to quickly narrow down search results. E.g. type in "technology" to only display records in the technology sector (as well as any records with "technology" in company name). Note that to get a more comprehensive list of stocks in the "technology" sector, you should change the scope of query.
Symbol: The trading symbol of company. Click to open corresonding institutional holdings in a new window.
52-week High/Low: 1-year high/low price. Note that stocks traded on the OTC market or pink list do not have this information.
Acq/Dsp Transaction Count: The count of institutions that acquire/dispose corresponding stock, comparing with previous period. Brand new holdings (i.e. no holding in previous period) are shown in dark green. Adding more shares (to non-zero holding in previous period) are shown in light green (e.g. QFIN). Sold-outs are shown in dark red. Reducing shares (to non-zero holdings) are shown in light red.
The black thin bar is a constant size ruler for easy comparison between symbols.
Ids/Sec/Mkt Quant: Quantile ranking of the number of transaction count compare with industry peers, sector peers, and the whole US market. The ranking is performed seperately for acquisitions(blue circles) and dispositions(red circles).
Acq/Dsp Shares Amount: The amount of shares being acquired/disposed by institutions, comparing with previous period. The colorization scheme is same as described in Acq/Dsp Transaction Count.
Acq/Dsp Dollar Amount(Mil USD): The market value of shares being acquired/disposed by institutions.
Shares Outstanding: Outstanding shares of corresponding period.
Acq/Dsp PctSO: The percentage of acquisition/disposition shares amount relative to shares outstanding.
Top Disposition
Similar to "Top Acquisition" but disposition has precedence over acquisition