


- Introduction
- Function Introduction
- Performance Monitor
- Fusion Hunter
- Quantitative Chart
- SEC Filing
- Insider Trading (Search by Ticker)
- Insider Trading (Search by Reporter)
- Insider Trading (Top Insider Trading)
- Institutional Holdings
- Investment Trends (Investment Company List)
- Investment Trends (Sector & Industry Sentiment)
- Investment Trends (Investment Company Sentiment)
- Investment Trends (Top Institutional Trading)
- Investment Trends (Top Institutional Hldg Change)
- Key Ratio Distribution
- Screener
- Financial Statement
- Key Metrics
- High Current Difference
- Low Current Difference
- Relative Strength Index
- KDJ
- Bollinger Bands
- Price Earnings Ratio
- Price to Book Value
- Debt Equity Ratio
- Leverage Ratio
- Return on Equity
- Return on Assets
- Gross Margin
- Net Profit Margin
- Operating Margin
- Income Growth
- Sales Growth
- Quick Ratio
- Current Ratio
- Interest Coverage
- Institutional Ownership
- Sector & Industry Classification
- Data Portal
- API
- SEC Forms
- Form 4
- Form 3
- Form 5
- CT ORDER
- Form 13F
- Form SC 13D
- Form SC 14D9
- Form SC 13G
- Form SC 13E1
- Form SC 13E3
- Form SC TO
- Form S-3D
- Form S-1
- Form F-1
- Form 8-k
- Form 1-E
- Form 144
- Form 20-F
- Form ARS
- Form 6-K
- Form 10-K
- Form 10-Q
- Form 10-KT
- Form 10-QT
- Form 11-K
- Form DEF 14A
- Form 10-D
- Form 13H
- Form 24F-2
- Form 15
- Form 25
- Form 40-F
- Form 424
- Form 425
- Form 8-A
- Form 8-M
- Form ADV-E
- Form ANNLRPT
- Form APP WD
- Form AW
- Form CB
- Form CORRESP
- Form DSTRBRPT
- Form EFFECT
- Form F-10
- Form F-3
- Form F-4
- Form F-6
- Form F-7
- Form F-9
- Form F-n
- Form X-17A-5
- Form F-X
- Form FWP
- Form G-405
- Form G-FIN
- Form MSD
- Form N-14
- Form N-18F1
- Form N-18F1
- Form N-30B-2
- Form N-54A
- Form N-8A
- Form N-CSR
- Form N-MFP
- Form N-PX
- Form N-Q
- Form TTW
- Form TA-1
- Form T-3
- Form SC 14F1
- Form SE
- Form SP 15D2
- Form SUPPL
- Form 10-12G
- Form 18-K
- Form SD
- Form STOP ORDER
- Form TH
- Form 1
- Form 19B-4(e)
- Form 40-APP
- Form 497
- Form ABS-15G
- Form DRS
- Form MA
- Form UNDER
- AI sentiment
- Access guide
- Academy
- Term of service
- GDPR compliance
- Contact Us
- Question Center
| Font Size: |
Investment Trends
Top Institutional Holding Change
This module monitors the stocks with the largest increase/decrease in proportion of institutional holdings (relative to shares outstanding). We use Projected Real Time Holding to determine the institutional holdings percentage at arbitrary time point. The information is updated every saturday around 5:30 AM US CDT.
Note this module is different from Top Institutional Trading, which provides top lists of acquisitions and dispositions by institutions, separately.
Configurations
Scope/Sector/Industry: Define query scope. Default is the whole US stock market. You can set search scope to specific sector or industry.
Max Hldg Chg: Maximum change in proportion of institutional holdings. i.e. Current institutional holding percentage - Previous institutional holding percentage. Set this to smaller value can avoid outliers caused by stock split or any other similar confounding factors.
Month Back: Compare current institutional holding percentage with that of 3 months or 6 months ago.
Min Hldg Pct Old: The minimum institutional holding percentage at previous time point.
Min Hldg Pct New The minimum institutional holding percentage at current time point.
Top Increase/Decrease of Institutional Holdings
The image below illustrates results of the top increase of institutional holdings in the energy sector
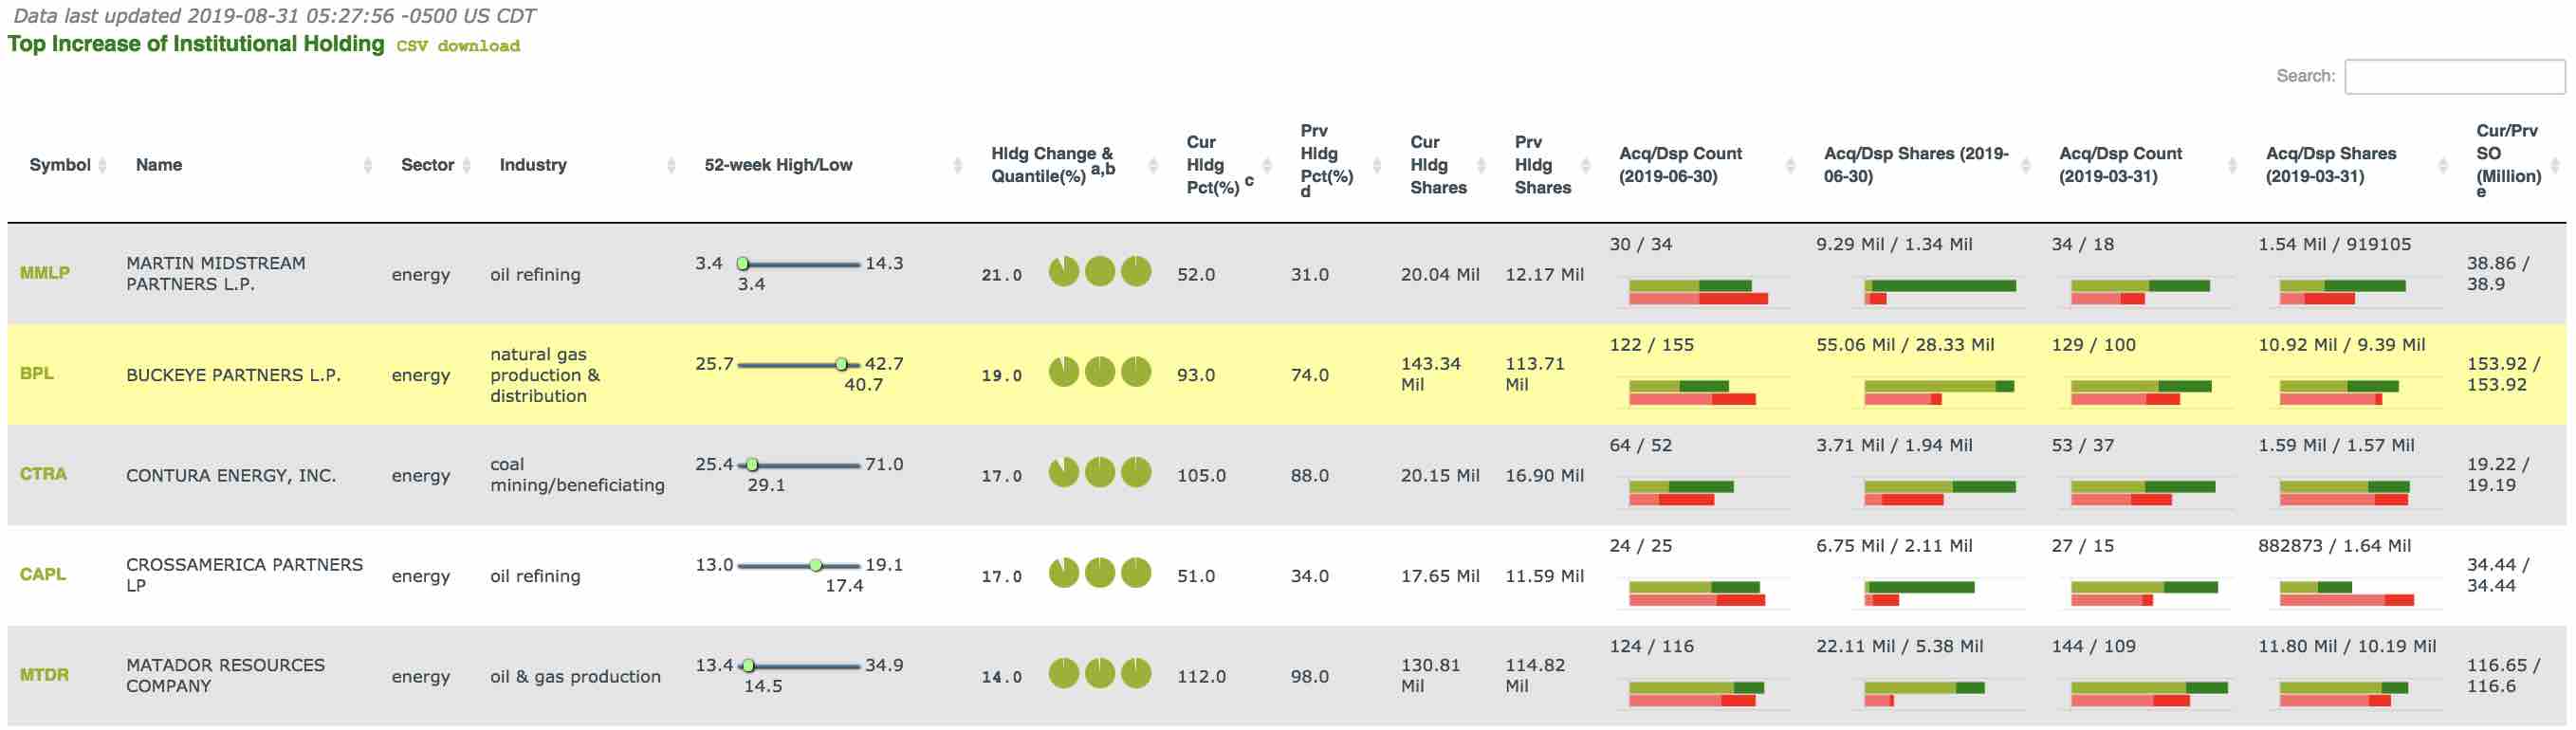
Quick Search: Type in any keyword (case insensitive) in the search box to quickly narrow down search results. E.g. type in "technology" to only display records in the technology sector (as well as any records with "technology" in company name). Note that to get a more comprehensive list of stocks in the "technology" sector, you should change the scope of query.
Symbol: The trading symbol of company. Click to open corresonding institutional holdings in a new window.
52-week High/Low: 1-year high/low price. Note that stocks traded on the OTC market or pink list do not have this information.
Hldg Change & Quantile: The difference between current and previous institutional holding percentage, as well as the quantile ranking of the difference compares with industry peers, sector peers, and the whole US market.
Cur Hldg Pct (%): The institutional holding percentage at current time point. Note this number might be greater than 100%, due to stock split, confidential treatment, or misrepresentation.
Prv Hldg Pct (%): The institutional holding percentage at previous time point (3 or 6 months ago). Note this number might be greater than 100%, due to stock split, confidential treatment, or misrepresentation.
Cur Hldg Shares: The institutional holding shares at current time point.
Prv Hldg Shares: The institutional holding shares at previous time point (3 or 6 months ago).
Acq/Dsp Count (Shares) (period): The count (or shares amount) of acquisition/disposition transactions of specific period (compare with corresponding previous period). Brand new holdings (i.e. no holding in previous period) are shown in dark green. Adding more shares (to non-zero holding in previous period) are shown in light green. Sold-outs are shown in dark red. Reducing shares (to non-zero holdings) are shown in light red.
Cur/Prv SO (Million): The shares outstanding at current and previous time points.