


- Introduction
- Function Introduction
- Performance Monitor
- Fusion Hunter
- Quantitative Chart
- SEC Filing
- Insider Trading (Search by Ticker)
- Insider Trading (Search by Reporter)
- Insider Trading (Top Insider Trading)
- Institutional Holdings
- Investment Trends (Investment Company List)
- Investment Trends (Sector & Industry Sentiment)
- Investment Trends (Investment Company Sentiment)
- Investment Trends (Top Institutional Trading)
- Investment Trends (Top Institutional Hldg Change)
- Key Ratio Distribution
- Screener
- Financial Statement
- Key Metrics
- High Current Difference
- Low Current Difference
- Relative Strength Index
- KDJ
- Bollinger Bands
- Price Earnings Ratio
- Price to Book Value
- Debt Equity Ratio
- Leverage Ratio
- Return on Equity
- Return on Assets
- Gross Margin
- Net Profit Margin
- Operating Margin
- Income Growth
- Sales Growth
- Quick Ratio
- Current Ratio
- Interest Coverage
- Institutional Ownership
- Sector & Industry Classification
- Data Portal
- API
- SEC Forms
- Form 4
- Form 3
- Form 5
- CT ORDER
- Form 13F
- Form SC 13D
- Form SC 14D9
- Form SC 13G
- Form SC 13E1
- Form SC 13E3
- Form SC TO
- Form S-3D
- Form S-1
- Form F-1
- Form 8-k
- Form 1-E
- Form 144
- Form 20-F
- Form ARS
- Form 6-K
- Form 10-K
- Form 10-Q
- Form 10-KT
- Form 10-QT
- Form 11-K
- Form DEF 14A
- Form 10-D
- Form 13H
- Form 24F-2
- Form 15
- Form 25
- Form 40-F
- Form 424
- Form 425
- Form 8-A
- Form 8-M
- Form ADV-E
- Form ANNLRPT
- Form APP WD
- Form AW
- Form CB
- Form CORRESP
- Form DSTRBRPT
- Form EFFECT
- Form F-10
- Form F-3
- Form F-4
- Form F-6
- Form F-7
- Form F-9
- Form F-n
- Form X-17A-5
- Form F-X
- Form FWP
- Form G-405
- Form G-FIN
- Form MSD
- Form N-14
- Form N-18F1
- Form N-18F1
- Form N-30B-2
- Form N-54A
- Form N-8A
- Form N-CSR
- Form N-MFP
- Form N-PX
- Form N-Q
- Form TTW
- Form TA-1
- Form T-3
- Form SC 14F1
- Form SE
- Form SP 15D2
- Form SUPPL
- Form 10-12G
- Form 18-K
- Form SD
- Form STOP ORDER
- Form TH
- Form 1
- Form 19B-4(e)
- Form 40-APP
- Form 497
- Form ABS-15G
- Form DRS
- Form MA
- Form UNDER
- AI sentiment
- Access guide
- Academy
- Term of service
- GDPR compliance
- Contact Us
- Question Center
| Font Size: |
Institutional Holdings
Configurations
Query Box: Input ticker(s) here. You can query up to 8 (tier ≥ 1) or 2 (guest or tier 0) tickers at the same time.
Shares≥ The minimum number of shares required to be displayed in the stacked bar chart. Note this does not affect summary statistics in other fields.
Values≥ The minimum holding values (in USD) required to be displayed in the stacked bar chart. Note this does not affect summary statistics in other fields.
Reporting Period: The historical period to be displayed in the stacked bar chart.
Projected Holding: The historical period to be displayed in the real time projected holding chart.
Institutional Sentiment
This section shows the institutional transaction count and shares amount for current and previous reporting period.
C: The count of institutions that acquire/dispose corresponding stock, comparing with previous period.
S: The shares amount being acquired/disposed by institutions, illustrated by horizontal bar chart on the right. Brand new holdings (i.e. no holding in previous period) are shown in dark green. Adding more shares (to non-zero holding in previous period) are shown in light green. Sold-outs are shown in dark red. Reducing shares (to non-zero holdings) are shown in light red.
Holdings Summary
Holding Shares
The number of shares held by investment institutions that files report. The numbers in parentheses are 1) the percentage of institutional holdings relative to shares outstanding, 2) the holding percentage change relative to 3 month and 3) 1 year ago.
| Holding Shares: | 3553.21 Mil (Pct:64.0% 3M:-1.0% 1Yr:-5.0%) |
For example, as of Nov 15th 2015, Apple Inc. (NAS:AAPL) has 3.5 billion shares held by investment institutions. This accounts for 64% of Apple Inc's outstanding shares, which is 1% less than 3 month ago (65%) and 5% less than 1 year ago (69%) [based on projected real time holding].
Institutions Reported
The number of institutions that filed Form 13f for current and last period. The numbers in parentheses are the percentage of institution that increase, decrease, restatement (no change), and sold out (all) shares of the corresponding security
| institution Reported: | 1916/2293 (Acq:53% Dis:39% Res:6% Sold out:0%) |
For example, as of Nov 15th 2015, 1916 institutions reported holding of AAPL for the period 2015-09-30. There were 2293 institutions reported in the last period (2015-06-30). Of the 1916 institutions, 53% increased the holding shares, 39% decreased the holding shares, 6% hold the same amount of shares, 0% sold out all holdings.
Industry/Sector/Market Quantile
The quantile ranking of the institutional holding percentage in the corresponding industry, sector, or on the whole market. The numbers in parentheses are the quantile ranking change relative to 3 months and 1 year ago
| Industry Quantile: | 31% (3M:0% 1Yr:-19%) |
For example, as of Nov 15th 2015, the institutional holding percentage of AAPL is higher than 31% of other companies in the same industry. This ranking is same as 3 months ago, and 19% down from 1 year ago (50%)
Quarterly Report
Quarterly report tracks the shares held by each institution that was reported quarterly to the SEC on Form 13F (after correction). It monitors the overall and individual institutional holding of corresponding security. Quarterly report is updated daily to reflect any new holdings as well as any amendments to current or previous period report.
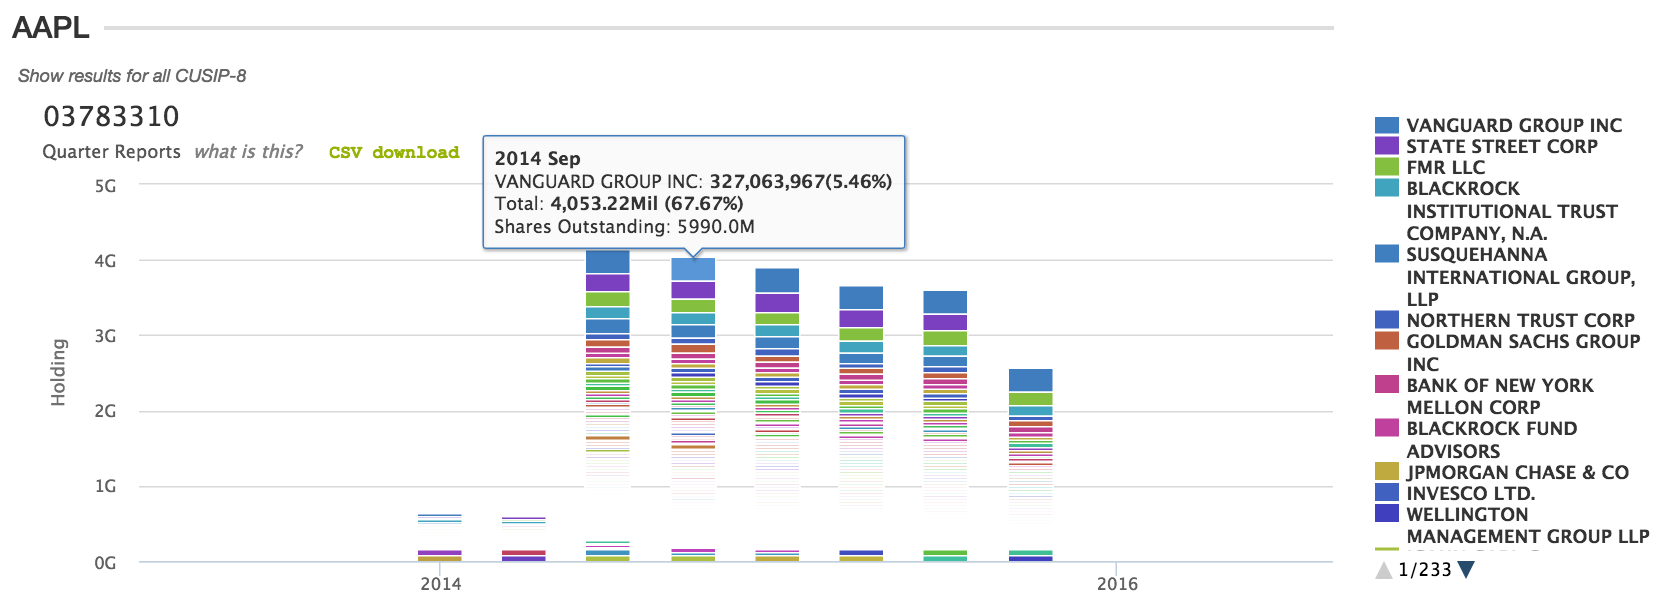
The figure above illutrates the quarterly institutional holding report on Apple Inc. (NAS:AAPL). There is a constant decrease in reported institutional holding from the 2nd quarter of 2014 to the 2nd quarter of 2015. The holding information for the 3rd quarter of 2015 is only available for some institutions, and others are not reported yet (as of this writing). Vanguard Group Inc. is the largest shareholder of AAPL. It held about 327 Million shares on the 3rd quarter of 2014, which accounts for 5.46% of the shares outstanding of AAPL. At the same period, the total amount of shares held by institutions was about 4 Billion shares, which accounts for 67.67% of the outstanding shares.
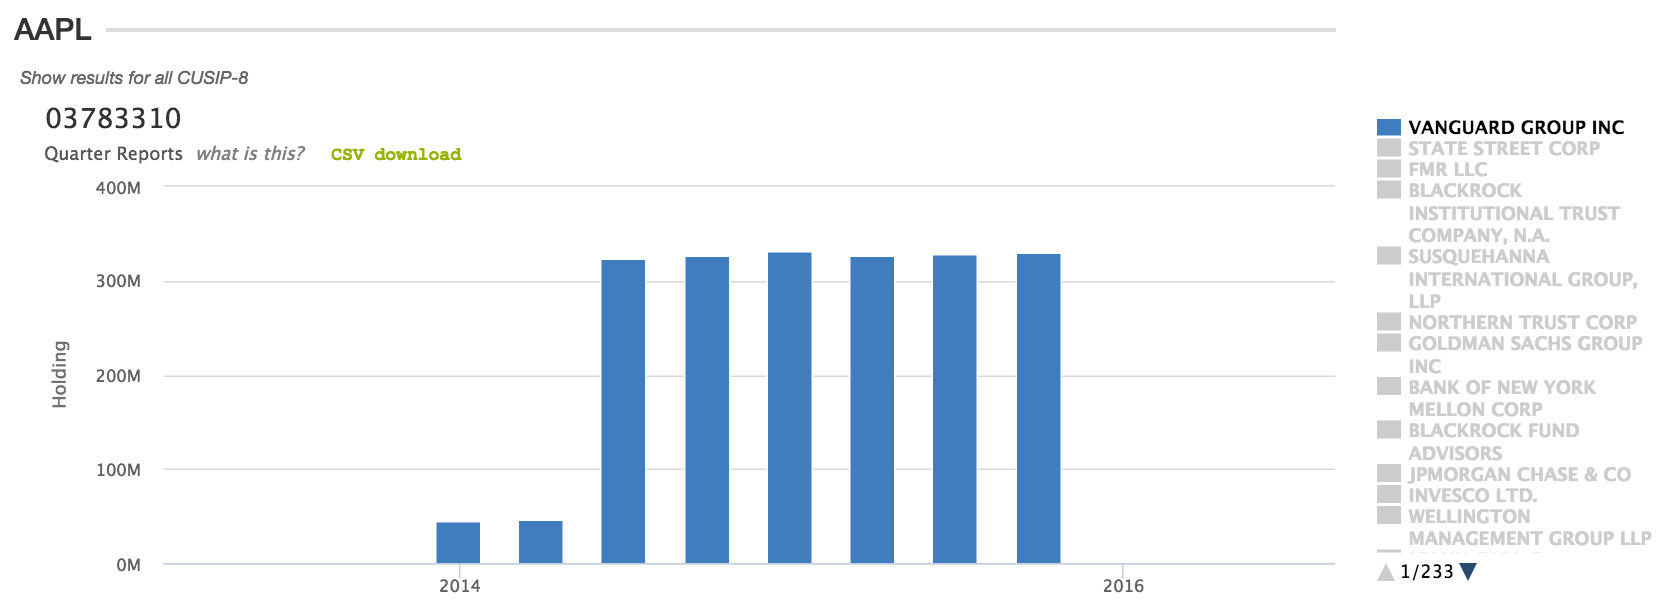
At individual institution level (by clicking the stacked bar), despite of the overall decrease in institutional holding on AAPL, Vanguard Group Inc. didn't change the holding significantly
Due to late filing and confidential treatment, quarterly report is more meaningful for analyzing holding histories that are older than at least one quarter, and less useful in monitoring holding trend of current period.
Projected Real Time Holding
Projected real time holding tracks the holding of corresponding security, using the most recently available information from each institution. As a simple example, 1916 institutions reported holding status of AAPL for the 3rd period of 2015, and 2293 institutions reported in the 2nd period. For the 377 institutions temporarily without report, projected real time holding uses holding information from the closest period, assuming no change in holding shares. In reality, projected real time holding tracks three quarters (270 days) for each institution without up to date period report, and uses its closest holding information as current holding on the day when analysis was performed. Projected real time holding is updated every Sunday.
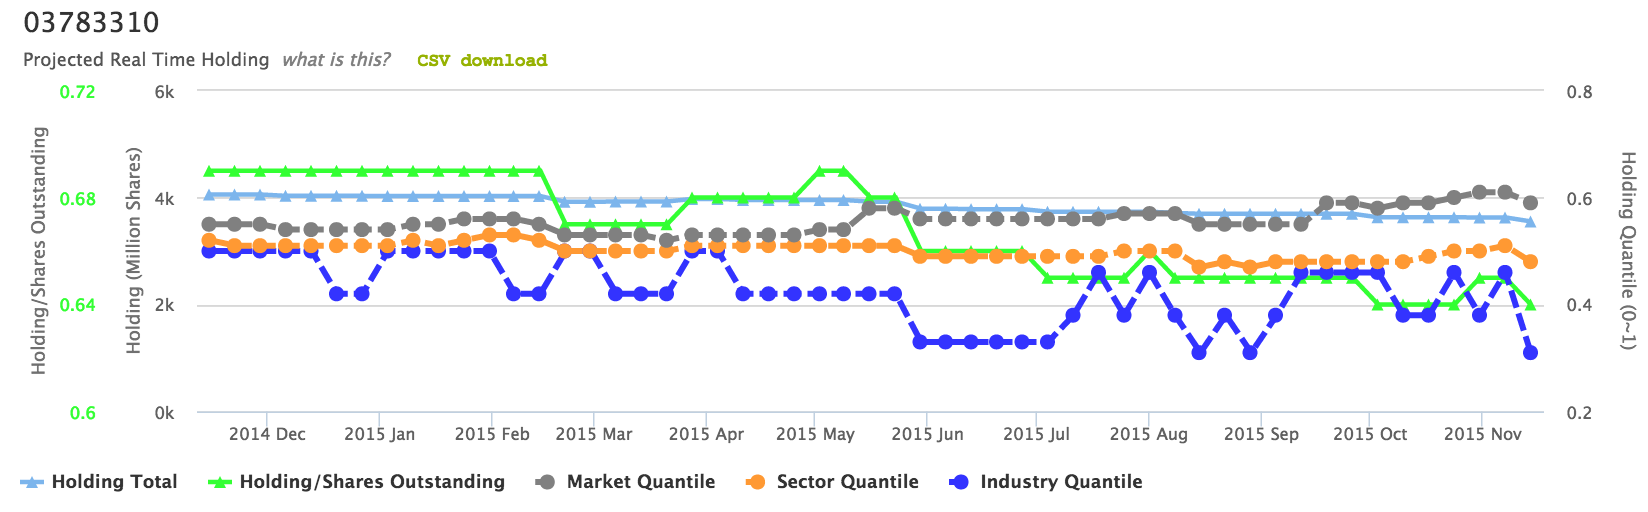
Besides of tracking institutional holding total and percentage of holding to shares outstanding, it also documented the quantile ranking of the holding percentage in corresponding industry, sector, and on the whole market. The figure above shows the projected real time holding of AAPL, which indicates a decrease in holding total (light blue), holding/shares outstanding (green), holding industry quantile (blue) from Nov 2014 to Nov 2015. However, there is no change in sector quantile (dark yellow), and slight increase in market quantile (grey), suggesting institutions are disposing shares in other industry(ies) or sector(s).