


- Introduction
- Function Introduction
- Performance Monitor
- Fusion Hunter
- Quantitative Chart
- SEC Filing
- Insider Trading (Search by Ticker)
- Insider Trading (Search by Reporter)
- Insider Trading (Top Insider Trading)
- Institutional Holdings
- Investment Trends (Investment Company List)
- Investment Trends (Sector & Industry Sentiment)
- Investment Trends (Investment Company Sentiment)
- Investment Trends (Top Institutional Trading)
- Investment Trends (Top Institutional Hldg Change)
- Key Ratio Distribution
- Screener
- Financial Statement
- Key Metrics
- High Current Difference
- Low Current Difference
- Relative Strength Index
- KDJ
- Bollinger Bands
- Price Earnings Ratio
- Price to Book Value
- Debt Equity Ratio
- Leverage Ratio
- Return on Equity
- Return on Assets
- Gross Margin
- Net Profit Margin
- Operating Margin
- Income Growth
- Sales Growth
- Quick Ratio
- Current Ratio
- Interest Coverage
- Institutional Ownership
- Sector & Industry Classification
- Data Portal
- API
- SEC Forms
- Form 4
- Form 3
- Form 5
- CT ORDER
- Form 13F
- Form SC 13D
- Form SC 14D9
- Form SC 13G
- Form SC 13E1
- Form SC 13E3
- Form SC TO
- Form S-3D
- Form S-1
- Form F-1
- Form 8-k
- Form 1-E
- Form 144
- Form 20-F
- Form ARS
- Form 6-K
- Form 10-K
- Form 10-Q
- Form 10-KT
- Form 10-QT
- Form 11-K
- Form DEF 14A
- Form 10-D
- Form 13H
- Form 24F-2
- Form 15
- Form 25
- Form 40-F
- Form 424
- Form 425
- Form 8-A
- Form 8-M
- Form ADV-E
- Form ANNLRPT
- Form APP WD
- Form AW
- Form CB
- Form CORRESP
- Form DSTRBRPT
- Form EFFECT
- Form F-10
- Form F-3
- Form F-4
- Form F-6
- Form F-7
- Form F-9
- Form F-n
- Form X-17A-5
- Form F-X
- Form FWP
- Form G-405
- Form G-FIN
- Form MSD
- Form N-14
- Form N-18F1
- Form N-18F1
- Form N-30B-2
- Form N-54A
- Form N-8A
- Form N-CSR
- Form N-MFP
- Form N-PX
- Form N-Q
- Form TTW
- Form TA-1
- Form T-3
- Form SC 14F1
- Form SE
- Form SP 15D2
- Form SUPPL
- Form 10-12G
- Form 18-K
- Form SD
- Form STOP ORDER
- Form TH
- Form 1
- Form 19B-4(e)
- Form 40-APP
- Form 497
- Form ABS-15G
- Form DRS
- Form MA
- Form UNDER
- AI sentiment
- Access guide
- Academy
- Term of service
- GDPR compliance
- Contact Us
- Question Center
| Font Size: |
Insider Trading (Search by Ticker)
Insider trading (Search by Ticker) tracks the insider transactions of specific company. The insider transactions are filed on Form 3/4/5 to the SEC by president, director, CEO, CFO, 10% Owner, and any other material individuals or entities. The information is updated daily around 4:30 AM CDT.
- Configurations
- Insider Sentiment
- Major Shareholders
- Non-derivative/Derivative Transactions
- Form 3
- West Panel
Configurations
Query Box: Input ticker(s) here. You can query up to 8 (tier ≥ 1) or 2 (guest or tier 0) tickers at the same time.
Month Back: Show transaction records of how long ago.
%(Owned): The minimum threshold of percentage of transaction shares to remaining shares (denominator). For acquisitions, the denominator is remaining shares after transaction. For dispositions, the denominator is shares owned before transaction.
‱(Shares Outstanding): The minimum threshold of permyriad (1 in ten thousand) of transaction shares to shares outstanding. Transactions below this threshold will not be displayed
Transaction Code: Limit the query to specific transaction type(s), as explained in Form 4.
Note that the configurations above affect Non-derivative/Derivative transactions, Form 3 table, and west panel. The "Insider Sentiment" and "Major Shareholders" sections are not affected.
Insider Sentiment
This section shows the 3-month and 6-month vital&spontaneous* transaction count and shares amount. The horizontal bar chart illustrates shares amount. Acquisitions have green color
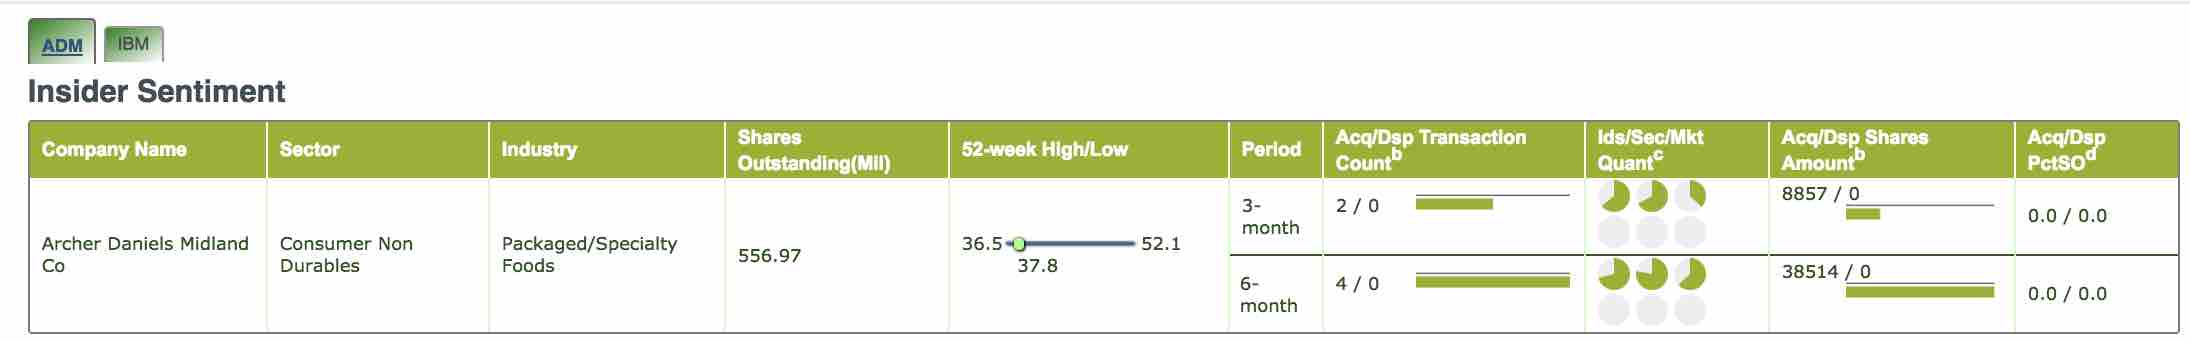
Dispositions have red color
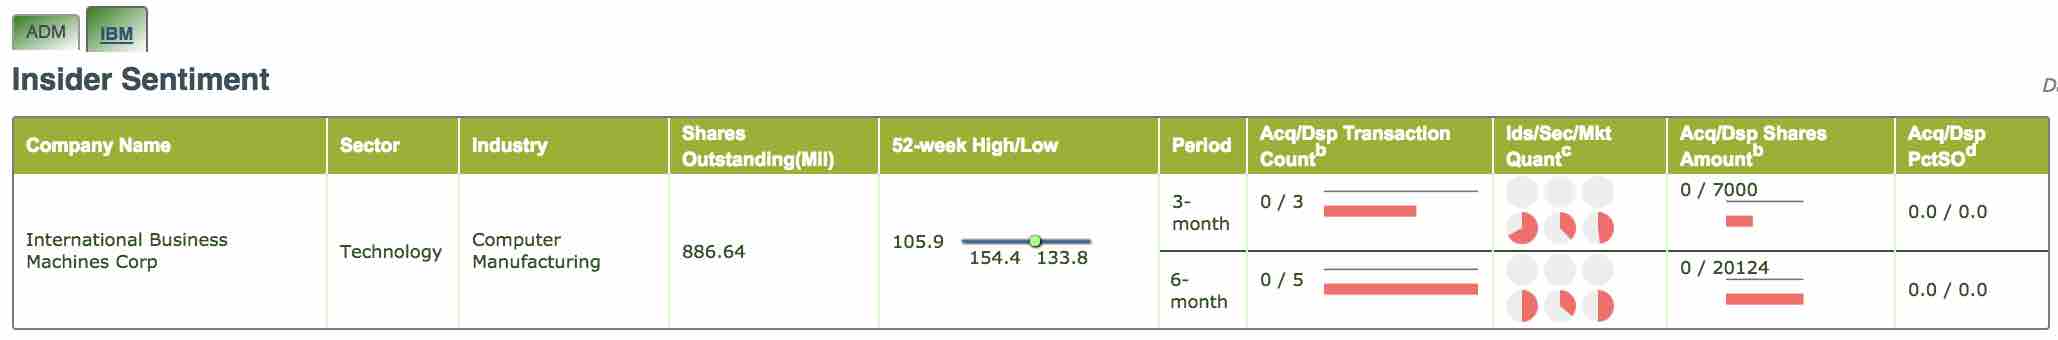
The black thin line is a constant size ruler for easy comparison between 3-month and 6-month data.
The pie charts under "Ids/Sec/Mkt Quant" field illustrate quantile ranking of transaction count among industry peers, sector peers, and the US market, respectively.
Major Shareholders
This table shows the major shareholders in descending order of shares owned.
Shareholder: The name of shareholder. Click to open holding details (reported on Form 3/4/5) of specific shareholder in a new window. See Insider Trading (Search by Reporter) for detail.
Report Date: The last time a Form 3/4/5 filing was filed by the shareholder.
Holding Pct: The percentage of shares owned relative to shares outstanding.
Shares: Total shares owned in both direct and indirect accounts. The percentages in parentheses are changes comparing with previous report and 3 months ago, respectively. The latter is shown as NA when no change was found in the last 3 months.
Shares(Previous Report Date): The shares owned in previous report, and the corresponding date of report.
Transactions (3-month/6-month): The vital&spontaneous* transaction count and shares amount of corresponding insider. "C:" count of number of transactions. "S:" shares amount involved in corrresponding transactions. "P:" average per share price of the transactions (for reference only). Horizontal bar chart denotes shares amount of acquisitions and dispositions.
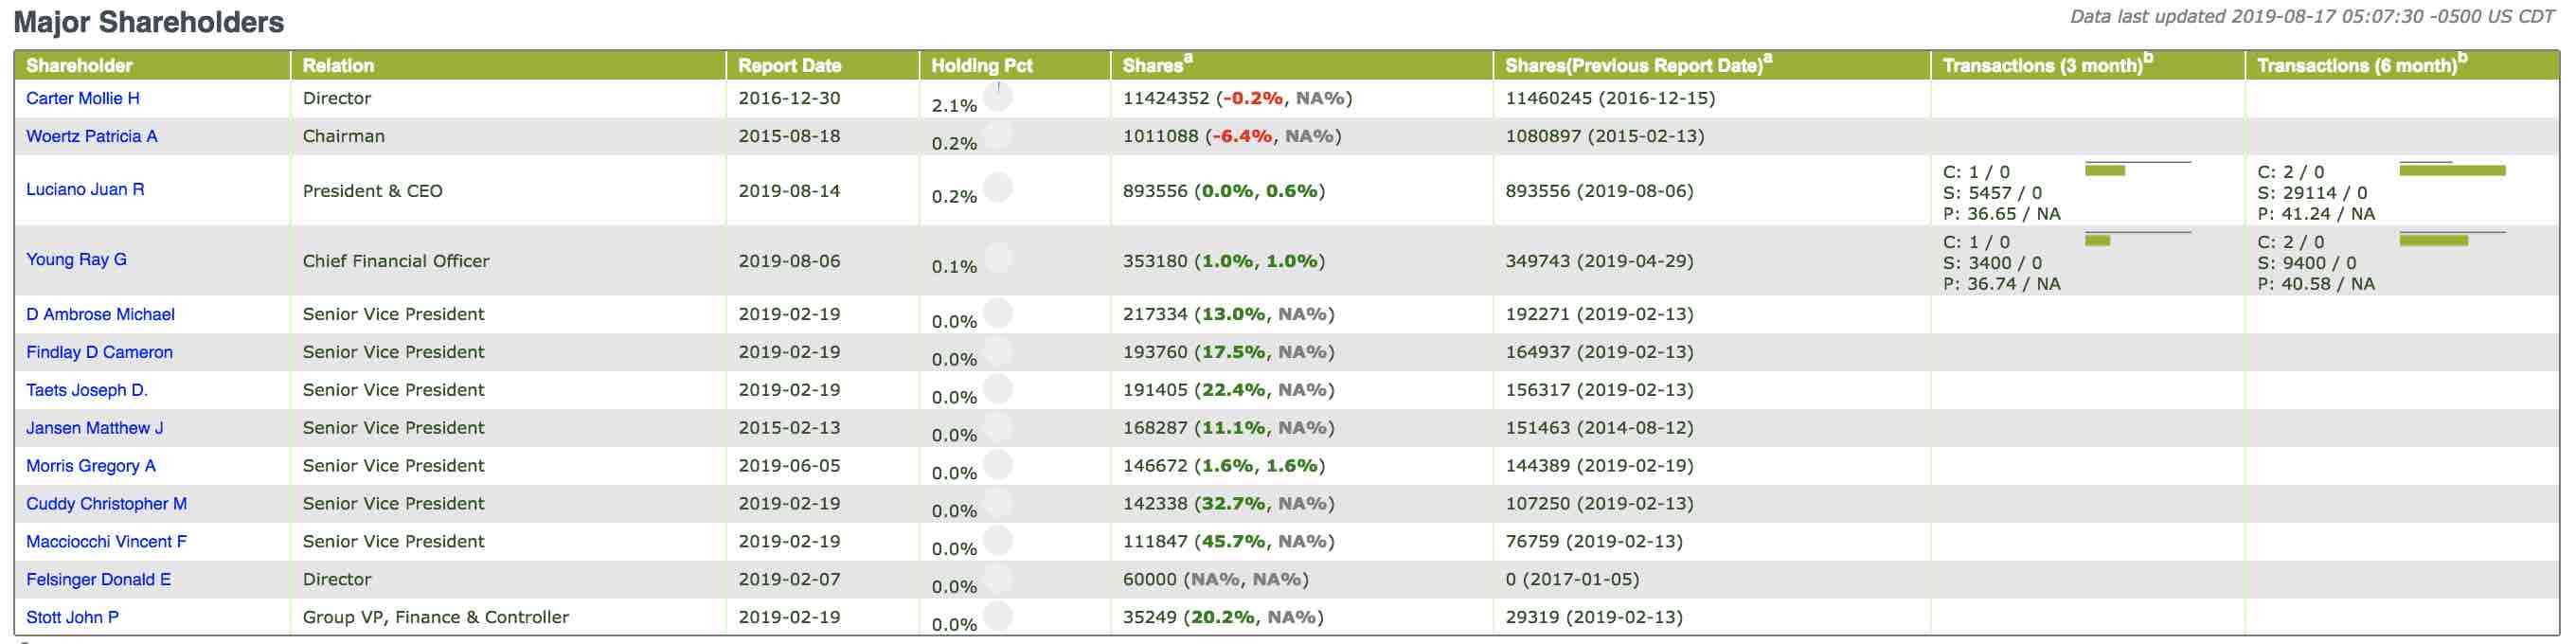
In the above example, Luciano Juan R acquired 5457 shares of ADM at price of $36.56 per share in 1 vital&spontaneous* transaction in the past 3 months. The black thin line is a constant size ruler for easy comparison between reporters and between 3-month and 6-month data.
* For acquisitions, code P (open market purchase), L (small acquisition), and I (at discretion of broker) are counted. For dispositions, code S (open market sell), D (sell back to issuer) and I (at discretion of broker) are counted. Other codes like code F (tax payment by security), G (gift) are less important in decision making and not considered.
Non-derivative/Derivative Transactions
The table shows the transactions of non-derivative/derivative securities filed on Form 4/5 as well as corresponding amendments. Purchasing, acquisition, or related operations that result in an increase of the holding shares are labeled as "acq"(Acquisition) and colored with green background. Any operations that cause a decrease in the holding shares are labeled as "dsp"(Disposition) and colored with red background. For each single Form 4/5 filing, multiple transactions (with either same or different transaction codes) that have the same security, account, and operation type will be shown in one line (as shown below).
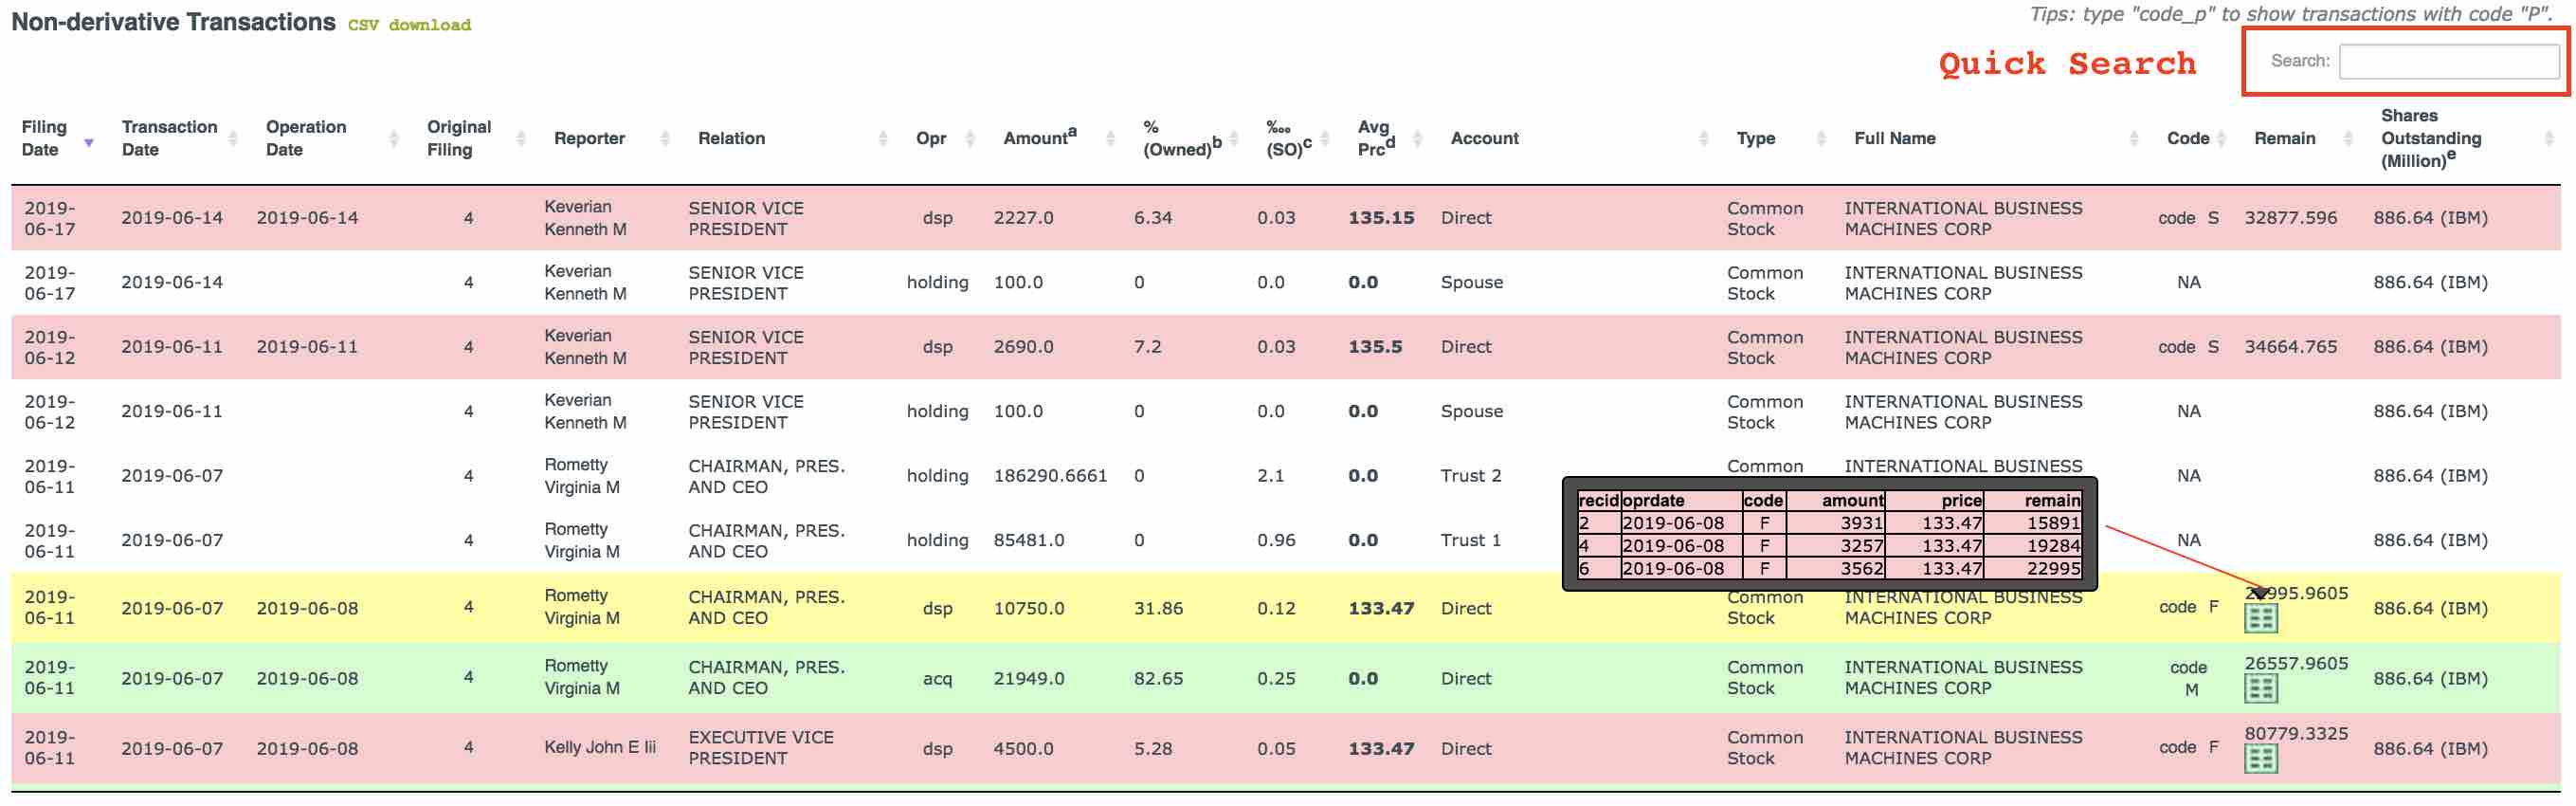
Quick Search: Type in any keyword string (case insensitive) to quickly narrow down search results. For example, type "keverian kenneth" to only display filings by Keverian Kenneth M. Type "dsp" to only display dispositions. Type "Direct" to only display direct account. Specifically, type "code_x" ("x" can be any transaction code introduced in Form 4. The underscore is used exclusively in "Code" field) to show transactions with specific code.
Operation Date: A date, or a range of dates when the operation(s) was/were performed.
Original Filing: The type of original filing. Click to open original filing in a new window.
Opr: Type of operation. Possible values are acq(acquisition), dsp(disposition), and holding.
Amount: For holdings, this number represents the holding shares. For acquisitions or dispositions, this number represents the transaction shares.
%(Owned): The percentage of transaction shares to remaining shares (denominator). For acquisitions, the denominator is remaining shares after transaction. For dispositions, the denominator is shares owned before transaction.
‱(SO): The permyriad (1 in ten thousand) of transaction shares to shares outstanding.
Avg Prc: Average transaction price for securities of the same type. Check the original form for detailed prices of multiple transactions.
Account: This field can be either "Direct" account, or indirect account with specific account name (e.g. "Spouse", "Trust").
Type: Type of security.
Full Name: Full name of the issuer of the security.
Code: Transaction code. See Form 4 for details.
Remain: The remaining shares after transaction (acq/dsp). Note that holding shares are shown in "Amount" field. For multiple transactions, a thumbnail table will be displayed. Mouse over the thumbnail to shown all transactions.
Shares Outstanding: Outstanding shares at the time of transaction.
Form 3
This table is similar to non-derivative/derivative tables,
West Panel
The west panel provides a quick graphic view of the records shown in non-derivative and derivative tables. Mouse over any bar to show transaction details. Click any bar to highlight corresponding record in non-derivative or derivative table.
-
Transaction shares amount
The transaction shares amount is shown in thousand shares per unit. See example below.
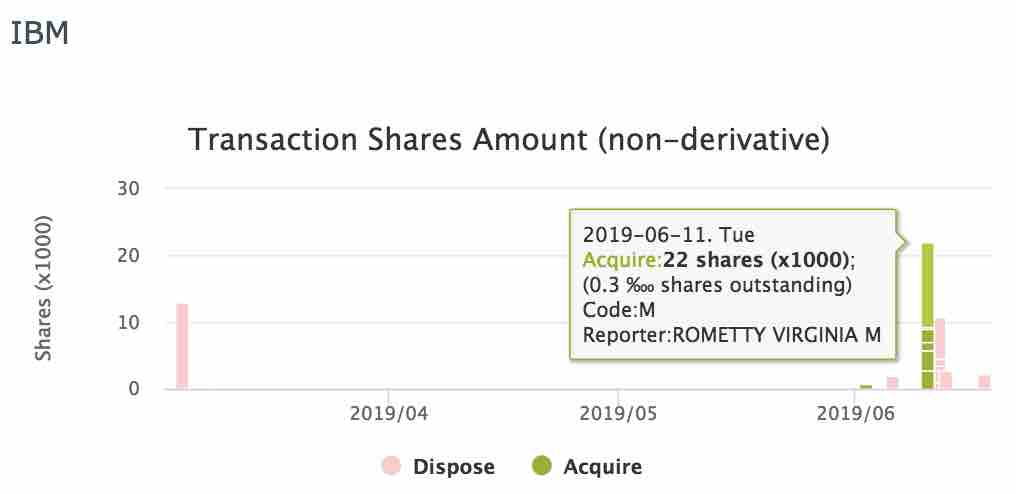
Click the bar shown above will highlight corresponding transaction records in non-derivative table.
Note that Code M (exercise derivative security) and C (conversion of derivative security) are recognized as acquisition operation (shown as green bars), and are most likely followed by open market sell(code S) or tax payment(code F). You can turn off these two code types in the options panel to remove the interference.
-
Relative to shares owned (%)(non-derivative)
For acquisition, the Y axis [shares owned (%)] represents the percentage of transcation amount over remaining shares after transaction.
For disposition, the Y axis [shares owned (%)] represents the percentage of transaction amount over the shares owned before transaction.
-
Relative to shares owned (%)(derivative)
The calculation is similar to the logic above but relative to remaining derivative shares.