


- Introduction
- Function Introduction
- Performance Monitor
- Fusion Hunter
- Quantitative Chart
- SEC Filing
- Insider Trading (Search by Ticker)
- Insider Trading (Search by Reporter)
- Insider Trading (Top Insider Trading)
- Institutional Holdings
- Investment Trends (Investment Company List)
- Investment Trends (Sector & Industry Sentiment)
- Investment Trends (Investment Company Sentiment)
- Investment Trends (Top Institutional Trading)
- Investment Trends (Top Institutional Hldg Change)
- Key Ratio Distribution
- Screener
- Financial Statement
- Key Metrics
- High Current Difference
- Low Current Difference
- Relative Strength Index
- KDJ
- Bollinger Bands
- Price Earnings Ratio
- Price to Book Value
- Debt Equity Ratio
- Leverage Ratio
- Return on Equity
- Return on Assets
- Gross Margin
- Net Profit Margin
- Operating Margin
- Income Growth
- Sales Growth
- Quick Ratio
- Current Ratio
- Interest Coverage
- Institutional Ownership
- Sector & Industry Classification
- Data Portal
- API
- SEC Forms
- Form 4
- Form 3
- Form 5
- CT ORDER
- Form 13F
- Form SC 13D
- Form SC 14D9
- Form SC 13G
- Form SC 13E1
- Form SC 13E3
- Form SC TO
- Form S-3D
- Form S-1
- Form F-1
- Form 8-k
- Form 1-E
- Form 144
- Form 20-F
- Form ARS
- Form 6-K
- Form 10-K
- Form 10-Q
- Form 10-KT
- Form 10-QT
- Form 11-K
- Form DEF 14A
- Form 10-D
- Form 13H
- Form 24F-2
- Form 15
- Form 25
- Form 40-F
- Form 424
- Form 425
- Form 8-A
- Form 8-M
- Form ADV-E
- Form ANNLRPT
- Form APP WD
- Form AW
- Form CB
- Form CORRESP
- Form DSTRBRPT
- Form EFFECT
- Form F-10
- Form F-3
- Form F-4
- Form F-6
- Form F-7
- Form F-9
- Form F-n
- Form X-17A-5
- Form F-X
- Form FWP
- Form G-405
- Form G-FIN
- Form MSD
- Form N-14
- Form N-18F1
- Form N-18F1
- Form N-30B-2
- Form N-54A
- Form N-8A
- Form N-CSR
- Form N-MFP
- Form N-PX
- Form N-Q
- Form TTW
- Form TA-1
- Form T-3
- Form SC 14F1
- Form SE
- Form SP 15D2
- Form SUPPL
- Form 10-12G
- Form 18-K
- Form SD
- Form STOP ORDER
- Form TH
- Form 1
- Form 19B-4(e)
- Form 40-APP
- Form 497
- Form ABS-15G
- Form DRS
- Form MA
- Form UNDER
- AI sentiment
- Access guide
- Academy
- Term of service
- GDPR compliance
- Contact Us
- Question Center
| Font Size: |
Leverage Ratio
Similar to debt equity ratio, leverage ratio is used for evaluating solvency and capital structure of a company. In Katelynn's Report, leverage ratio is calculated as Total Assets/Shareholder's Equity (Collinear with debt equity ratio. No additional contribution in multiple regression), which is the most widely used equation (Note that there are different ways to calculate leverage ratio. E.g. banks may use the equation Total Debt/12 Month EBITDAX, which is better for estimating how many fiscal years are needed to payoff the debt). High leverage ratio will undoubtedly constrain a company's access to additional low-cost bank capital. On the other hand, a very low leverage ratio may be a sign that operating margins are too tight. Leverage ratio has industry specific distribution. So usually it only makes sense to compare leverage ratio of copmanies within the same industry. When compare leverage ratio of companies from different industries, it is better to compare their relative performance in corresponding industry. Katelynn's Report assumes low leverage ratio is generally more preferred, thus lower leverage ratio has better performance (i.e. higher quantile ranking).
The figures below shows the distribution of leverage ratio on the whole market (left) and in technology sector (right) as of 2017-01-20 (solid blue), compared with 1 year ago (dashed pink). The two colored vertical lines marked the location of AAPL (Apple Inc.) and GOOG (Alphabet Inc.). Majority of companies have leverage ratio between 1 and 2. Generally, leverage ratio above 2 is considered high in debt burden, and a harder time to recover during economic downturn due to high interest expenses.
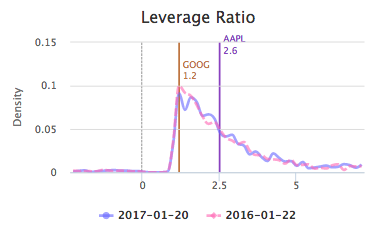
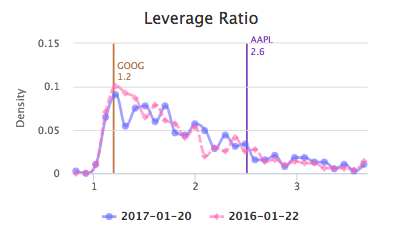
Below shows the leverage ratio of AAPL and GOOG as of 2017-01-20, as well as their performance relative to industry peers, sector peers, and the whole market.
AAPL Leverage Ratio: 2.51
|
GOOG Leverage Ratio: 1.2
|
AAPL and GOOG have distinct performances in leverage ratio. The leverage ratio of AAPL is higher (poorer) than industry and sector median (lower than 43% of industry peers, and 35% of sector peers). The leverage ratio of GOOG is among the best in the market as of 2017-01-20.