


- Introduction
- Function Introduction
- Performance Monitor
- Fusion Hunter
- Quantitative Chart
- SEC Filing
- Insider Trading (Search by Ticker)
- Insider Trading (Search by Reporter)
- Insider Trading (Top Insider Trading)
- Institutional Holdings
- Investment Trends (Investment Company List)
- Investment Trends (Sector & Industry Sentiment)
- Investment Trends (Investment Company Sentiment)
- Investment Trends (Top Institutional Trading)
- Investment Trends (Top Institutional Hldg Change)
- Key Ratio Distribution
- Screener
- Financial Statement
- Key Metrics
- High Current Difference
- Low Current Difference
- Relative Strength Index
- KDJ
- Bollinger Bands
- Price Earnings Ratio
- Price to Book Value
- Debt Equity Ratio
- Leverage Ratio
- Return on Equity
- Return on Assets
- Gross Margin
- Net Profit Margin
- Operating Margin
- Income Growth
- Sales Growth
- Quick Ratio
- Current Ratio
- Interest Coverage
- Institutional Ownership
- Sector & Industry Classification
- Data Portal
- API
- SEC Forms
- Form 4
- Form 3
- Form 5
- CT ORDER
- Form 13F
- Form SC 13D
- Form SC 14D9
- Form SC 13G
- Form SC 13E1
- Form SC 13E3
- Form SC TO
- Form S-3D
- Form S-1
- Form F-1
- Form 8-k
- Form 1-E
- Form 144
- Form 20-F
- Form ARS
- Form 6-K
- Form 10-K
- Form 10-Q
- Form 10-KT
- Form 10-QT
- Form 11-K
- Form DEF 14A
- Form 10-D
- Form 13H
- Form 24F-2
- Form 15
- Form 25
- Form 40-F
- Form 424
- Form 425
- Form 8-A
- Form 8-M
- Form ADV-E
- Form ANNLRPT
- Form APP WD
- Form AW
- Form CB
- Form CORRESP
- Form DSTRBRPT
- Form EFFECT
- Form F-10
- Form F-3
- Form F-4
- Form F-6
- Form F-7
- Form F-9
- Form F-n
- Form X-17A-5
- Form F-X
- Form FWP
- Form G-405
- Form G-FIN
- Form MSD
- Form N-14
- Form N-18F1
- Form N-18F1
- Form N-30B-2
- Form N-54A
- Form N-8A
- Form N-CSR
- Form N-MFP
- Form N-PX
- Form N-Q
- Form TTW
- Form TA-1
- Form T-3
- Form SC 14F1
- Form SE
- Form SP 15D2
- Form SUPPL
- Form 10-12G
- Form 18-K
- Form SD
- Form STOP ORDER
- Form TH
- Form 1
- Form 19B-4(e)
- Form 40-APP
- Form 497
- Form ABS-15G
- Form DRS
- Form MA
- Form UNDER
- AI sentiment
- Access guide
- Academy
- Term of service
- GDPR compliance
- Contact Us
- Question Center
| Font Size: |
Investment Trends
Investment Company Sentiment
This module monitors the portfolio of each investment company that files Form 13F, which is required to be reported to the SEC within 45 days after each quarter end (i.e. Mar 31st, Jun 30th, Sep 30th, Dec 31st). The data is updated daily around 6:00 AM US CDT.
Configurations
Query Box: Input CIK, or company name, or fund manager name of investment company. Only 1 entity is allowed on each query. If input is name, please wait a few seconds for the auto-complete function to fill in CIK. The database search is based on CIK.
For example, to make query on the portfolio of Berkshire Hathaway, just input 1067983 (i.e. CIK of the company), or "berkshire" (case insensitive), or "fm:[marc d."(i.e name of the fund manager), and then select corresponding entry from the drop-down list generated by auto-complete function.
Time Span: Choose from 3-month to MAX time span on the right side of the option panel. This will affect the historical portfolio chart. By default this is set to 2-year.
Portfolio by Sector/Industry
The following images are based on data reported by Berkshire Hathaway for the 2nd quarter of 2019.
These sections provide summarization of the institutional holdings grouped by sectors and by industries, respectively. Two presentation schemes are used. While both schemes determine the proportion of each sector (or industry) (as denoted by the area size on the treemap) by current market value, different colorization strategies are used to emphasize distinct features of current holdings compare with previous period. As shown below.
-
Percentage Change of Dollar Value
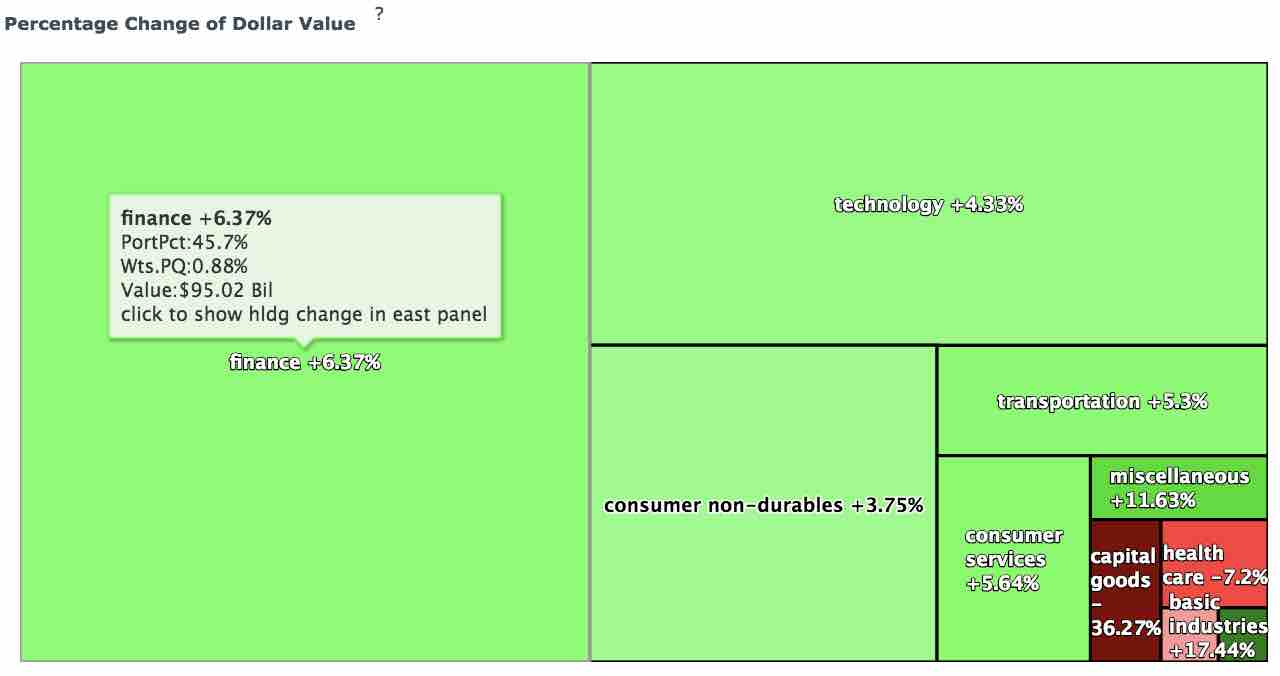
The tiles are colored by percentage changes in the market value of specific sector/industry compare with previous period. Green tile denotes increase in market value. Red tile denotes decrease in market value. Cyan tile denotes brand new holdings (i.e. no holding in corresponding sector/industry was found in previous period). White tile denotes no change in market value.
This colorization scheme reflects the overall effect of market appreciation/depreciation of share prices as well as acquisition/disposition, if any, at the discretion of portfolio manager.In the above example, the reporter has securities that worth $95.02 Bil in the finance sector, which is 6.37% higher than pervious period (i.e. 1st quarter of 2019). The finance sector accounts for 45.7% (weights) of its total portfolio value. The weights is 0.88 units higher than pervious period (44.82%).
Click the tile will open in east panel all holdings and transactions history in the finance sector. -
Acquisition/Disposition Percentage of Capital
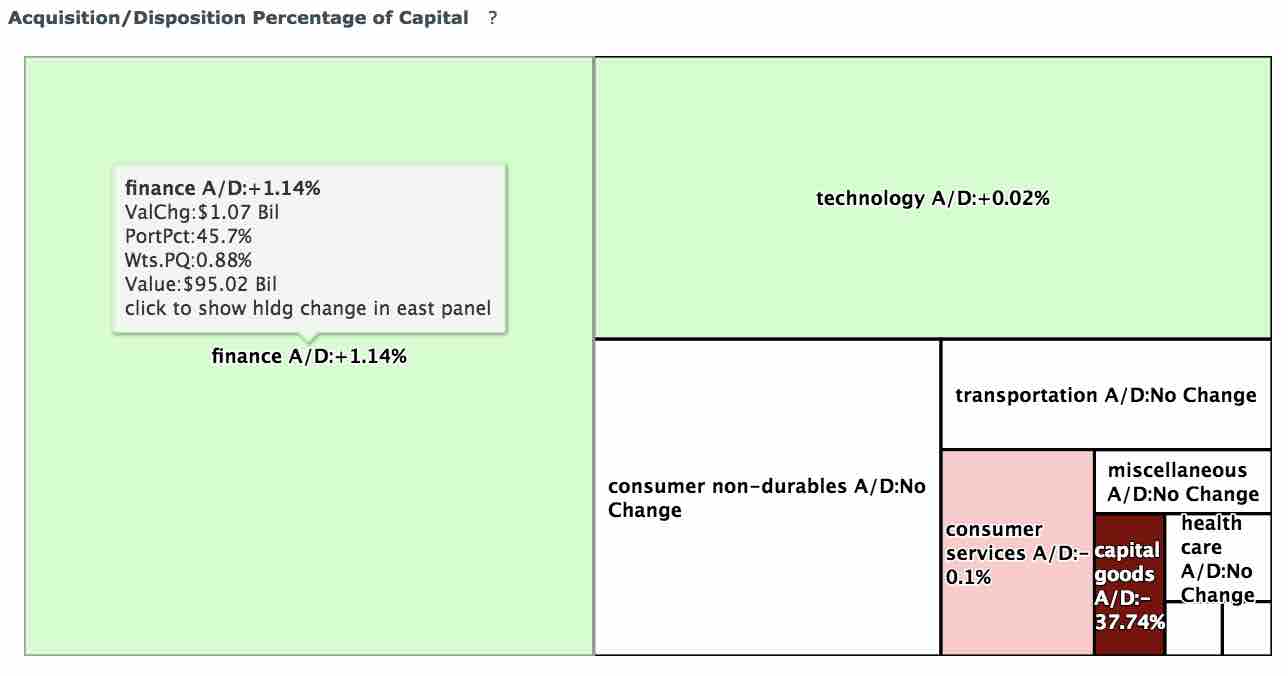
The tiles are colored by the overall acquisition/disposition dollar amount calculated from changes in shares amount multiplying deduced per share prices. Green tile denotes overall capital inflow. Red tile denotes overall capital outflow. Cyan tile denotes brand new holdings (i.e. no holding in corresponding sector/industry was found in previous period). White tile denotes no change in holding shares amount.
This colorization scheme mainly reflects the acquisition/disposition at the discretion of portfolio managers. In another word, there will be no change at all if there is no change in holding shares amount, regardless of any appreciation/depreciation of market price per share.In the above example, the reporter has a total of $1.07 Bil capital inflow into the finance sector, which accounts for 1.14% of sector total before inflow. Note while previous image shows 3.75% increase of the market value of the securities in the consumer non-durables sector, there is actually no capital inflow/outflow (i.e. the portfolio manager didn't make any change to the sector. The increase in market value is purely a result of market appreciation of share prices).
-
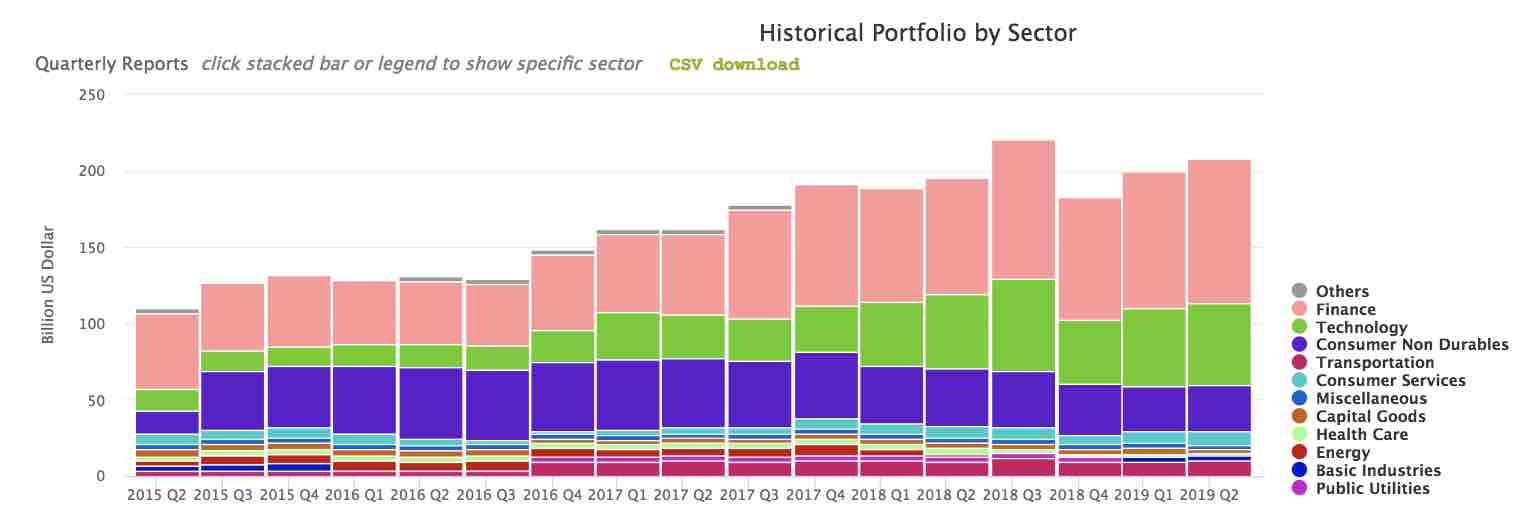
Historical Portfolio
The historical market value grouped by sector or by industry. The following image illustrates the holdings of Berkshire Hathaway grouped by sector since 2nd quarter of 2015.
Portfolio
This section provides the portfolio of investment company at per security level. For each security, its area sizes on the treemap is determined by its corresponding market value (i.e. holding shares multiply market price per share). The tile color is determined by percentage change of holding shares (NOT market value) compare with previous period. Green tile denotes increase in holding shares. Red tile denotes decrease in holding shares. White tile denotes no change (Restatement). Cyan tile denotes brand new holding.
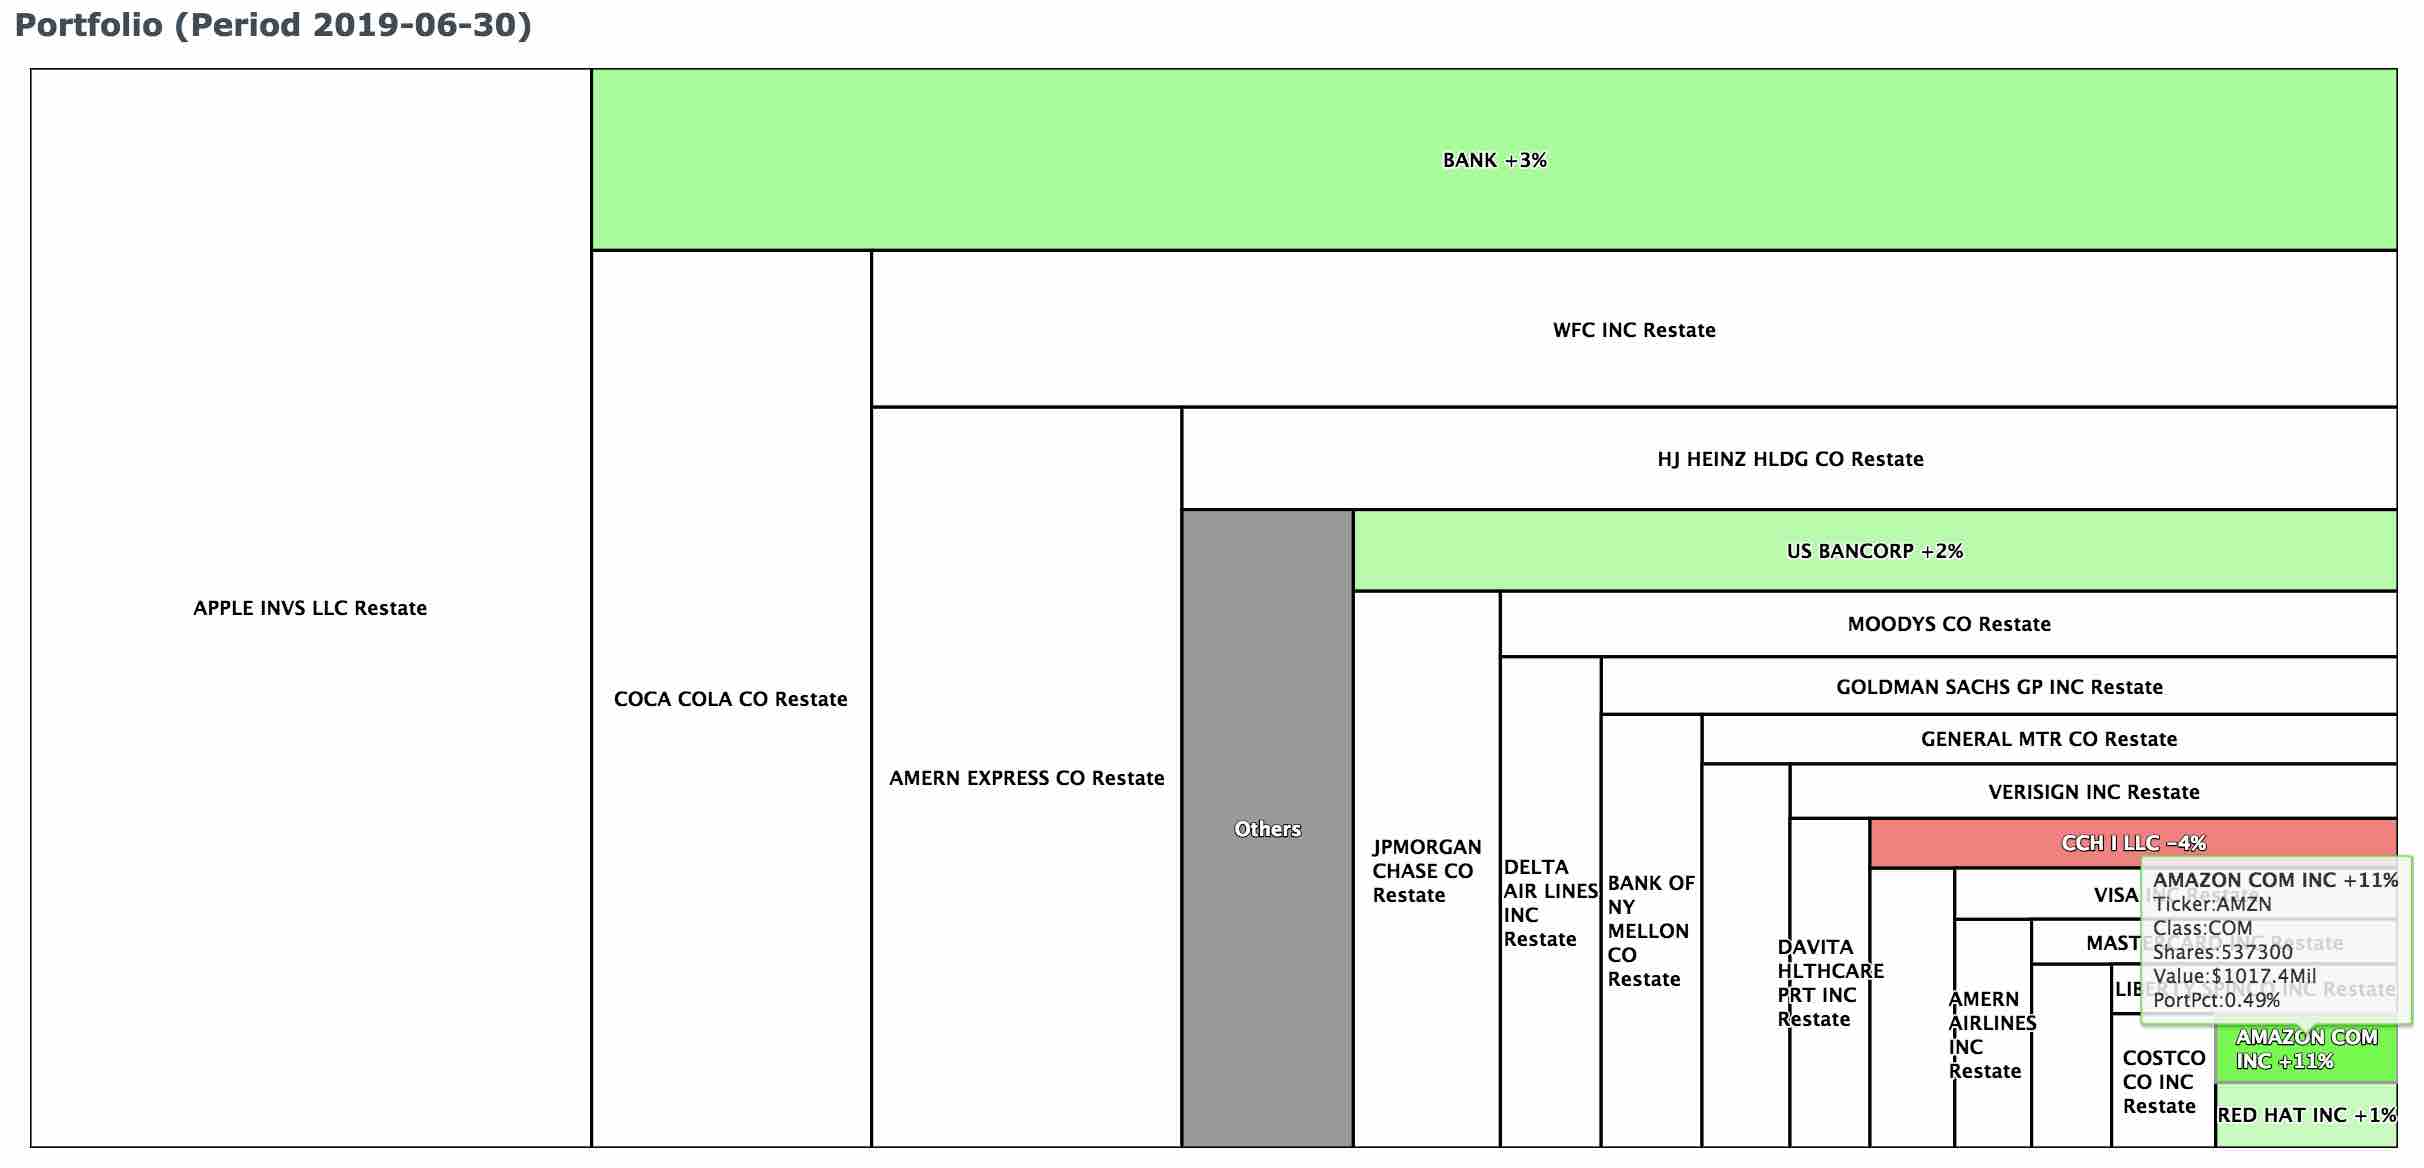
According to the treemap above, the reporter currently holds 537,300 shares of AMZN (Amazon Inc) common stocks, which has a market value of $1017.4 Mil and accounts for 0.49% of the reporter's total portfolio. This represents a 11% increase in holding shares of AMZN compare with previous period (i.e. 1st quarter of 2019).
Top Acquisitions/Dispositions
This section shows the top 20 acquisitions and dispositions of current period. As a reminder, the securities that were sold out won't be displayed in the treemap, and can only be found in the top dispositions table.
East Panel
This section provides the transactions histories reported on Form 13F and Form 13G/D, respectively. Specifically, click on any sector or industry tile in the central panel to enable filtering of transaction records to show specific sector or industry. Alternatively, type in keyword like "finance" into the quick search box on the top right corner to narrow down results to "finance" sector (the number of records might be trimmed due to max record limit).