


- Introduction
- Function Introduction
- Performance Monitor
- Fusion Hunter
- Quantitative Chart
- SEC Filing
- Insider Trading (Search by Ticker)
- Insider Trading (Search by Reporter)
- Insider Trading (Top Insider Trading)
- Institutional Holdings
- Investment Trends (Investment Company List)
- Investment Trends (Sector & Industry Sentiment)
- Investment Trends (Investment Company Sentiment)
- Investment Trends (Top Institutional Trading)
- Investment Trends (Top Institutional Hldg Change)
- Key Ratio Distribution
- Screener
- Financial Statement
- Key Metrics
- High Current Difference
- Low Current Difference
- Relative Strength Index
- KDJ
- Bollinger Bands
- Price Earnings Ratio
- Price to Book Value
- Debt Equity Ratio
- Leverage Ratio
- Return on Equity
- Return on Assets
- Gross Margin
- Net Profit Margin
- Operating Margin
- Income Growth
- Sales Growth
- Quick Ratio
- Current Ratio
- Interest Coverage
- Institutional Ownership
- Sector & Industry Classification
- Data Portal
- API
- SEC Forms
- Form 4
- Form 3
- Form 5
- CT ORDER
- Form 13F
- Form SC 13D
- Form SC 14D9
- Form SC 13G
- Form SC 13E1
- Form SC 13E3
- Form SC TO
- Form S-3D
- Form S-1
- Form F-1
- Form 8-k
- Form 1-E
- Form 144
- Form 20-F
- Form ARS
- Form 6-K
- Form 10-K
- Form 10-Q
- Form 10-KT
- Form 10-QT
- Form 11-K
- Form DEF 14A
- Form 10-D
- Form 13H
- Form 24F-2
- Form 15
- Form 25
- Form 40-F
- Form 424
- Form 425
- Form 8-A
- Form 8-M
- Form ADV-E
- Form ANNLRPT
- Form APP WD
- Form AW
- Form CB
- Form CORRESP
- Form DSTRBRPT
- Form EFFECT
- Form F-10
- Form F-3
- Form F-4
- Form F-6
- Form F-7
- Form F-9
- Form F-n
- Form X-17A-5
- Form F-X
- Form FWP
- Form G-405
- Form G-FIN
- Form MSD
- Form N-14
- Form N-18F1
- Form N-18F1
- Form N-30B-2
- Form N-54A
- Form N-8A
- Form N-CSR
- Form N-MFP
- Form N-PX
- Form N-Q
- Form TTW
- Form TA-1
- Form T-3
- Form SC 14F1
- Form SE
- Form SP 15D2
- Form SUPPL
- Form 10-12G
- Form 18-K
- Form SD
- Form STOP ORDER
- Form TH
- Form 1
- Form 19B-4(e)
- Form 40-APP
- Form 497
- Form ABS-15G
- Form DRS
- Form MA
- Form UNDER
- AI sentiment
- Access guide
- Academy
- Term of service
- GDPR compliance
- Contact Us
- Question Center
| Font Size: |
Bollinger Bands
Bollinger bands measure the volatility of stock price. It works by defining an upper and a lower bands between which stock price is most likely to fluctuate. The upper and lower bands are calculated through equation
BBU = SMA + K * SD
BBL = SMA - K * SD
SMA is the simple moving average of the last N periods. Investors conventionally use 20 periods. SD is the standard deviation* of the close price of corresponding periods. K typically equals to 2.
Within specific periods of interest, prices are considered high at the upper band and low at the lower band. However, the upper and lower bands should not be used to signal turning points, as prices may move along upper or lower bands, or breakout above or below the bands.
* divide by N rather than N - 1 because in this case N generates an unbiased estimate of the true population variance.
Bollinger bands width (BBW) measures the width of bollinger bands on a normalized basis.
BBW = (BBU - BBL) / SMA
BBU is the upper band. BBL is the lower band. SMA is the simple moving average.
BBW has the following distribution as of May 2018.
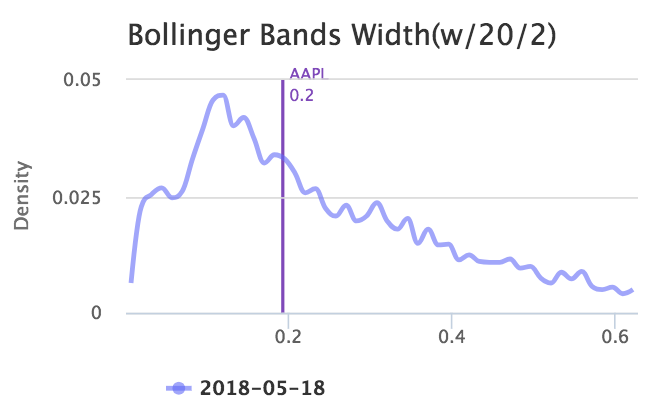
We calculated quantile ranking of BBW for each stock comparing with industry, sector, and market peers.
Bollinger bands percentage (BBP, or BB %b) measures the location of current price relative to BBU and BBL. It is calculated as
BBP = (close price - BBL) / (BBU - BBL) * 100%
Note that BBP can be a negative number or larger than 100%. When BBP equals to 50%, price is closed half way between BBL and BBU.
Bollinger Bands Constraint
In Katelynn's report, we use bollinger bands constraint (BBC) to quantify the squeeze (or breakout) level of the BBW of current period, comparing with previous several periods. BBC is calculated as
BBC = BBWcurrent / (BBWwavg * (1 + CV))
BBWcurrent is the BBW of current period.
CV is the coefficient of variation of BBW of the last N periods.
BBWwavg is weighted average BBW of the last N periods. In weekly mode, we let N = 5
BBWwavg = (BBWp1 * Wp1 + ... + BBWpN * WpN)/100
SUM(Wp1 + Wp2 + ... + WpN)=100
where pn represents n periods before current period. The weights for pn is calculated as
Wpn = (N - n + 1) * (100/SUM(1 + 2 + ... + N))
When N = 5, the weights array is
(5 * 100/15, 4 * 100/15, ... , 1 * 100/15) or (33.35, 26.67, 20.00, 13.34, 6.67)
The basic idea is to give more weights to periods closer to current period. Divide by (1 + CV) cancels out the confounding effect of background variation.
BBC has the following distribution as of May 2018
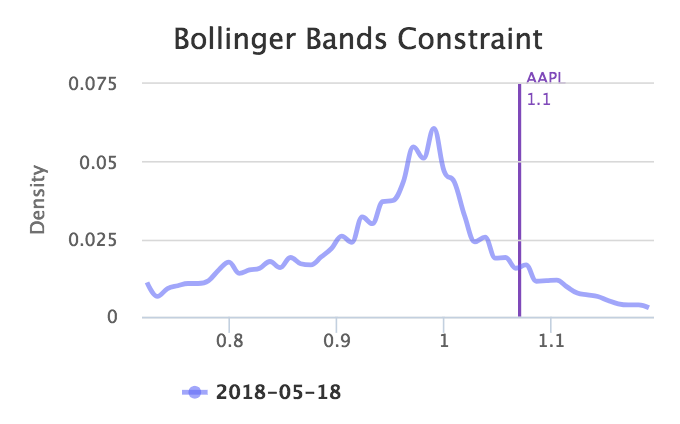
BBC less than 1 indicates a squeeze (i.e. the BB becomes narrower than before). BBC greater than 1 indicates a breakouts (i.e. the BB becomes wider than before). Usually, in weekly mode, BBC less than 0.8 or greater than 1.1 indicates a significant change in band widths. Investors can also rely on the performance monitor to determine how significant a squeeze (or breakouts) is comparing with peers. Generally, quantile ranking above 95% indicates significant breakouts, below 5% indicates significant squeeze.