


- Introduction
- Function Introduction
- Performance Monitor
- Fusion Hunter
- Quantitative Chart
- SEC Filing
- Insider Trading (Search by Ticker)
- Insider Trading (Search by Reporter)
- Insider Trading (Top Insider Trading)
- Institutional Holdings
- Investment Trends (Investment Company List)
- Investment Trends (Sector & Industry Sentiment)
- Investment Trends (Investment Company Sentiment)
- Investment Trends (Top Institutional Trading)
- Investment Trends (Top Institutional Hldg Change)
- Key Ratio Distribution
- Screener
- Financial Statement
- Key Metrics
- High Current Difference
- Low Current Difference
- Relative Strength Index
- KDJ
- Bollinger Bands
- Price Earnings Ratio
- Price to Book Value
- Debt Equity Ratio
- Leverage Ratio
- Return on Equity
- Return on Assets
- Gross Margin
- Net Profit Margin
- Operating Margin
- Income Growth
- Sales Growth
- Quick Ratio
- Current Ratio
- Interest Coverage
- Institutional Ownership
- Sector & Industry Classification
- Data Portal
- API
- SEC Forms
- Form 4
- Form 3
- Form 5
- CT ORDER
- Form 13F
- Form SC 13D
- Form SC 14D9
- Form SC 13G
- Form SC 13E1
- Form SC 13E3
- Form SC TO
- Form S-3D
- Form S-1
- Form F-1
- Form 8-k
- Form 1-E
- Form 144
- Form 20-F
- Form ARS
- Form 6-K
- Form 10-K
- Form 10-Q
- Form 10-KT
- Form 10-QT
- Form 11-K
- Form DEF 14A
- Form 10-D
- Form 13H
- Form 24F-2
- Form 15
- Form 25
- Form 40-F
- Form 424
- Form 425
- Form 8-A
- Form 8-M
- Form ADV-E
- Form ANNLRPT
- Form APP WD
- Form AW
- Form CB
- Form CORRESP
- Form DSTRBRPT
- Form EFFECT
- Form F-10
- Form F-3
- Form F-4
- Form F-6
- Form F-7
- Form F-9
- Form F-n
- Form X-17A-5
- Form F-X
- Form FWP
- Form G-405
- Form G-FIN
- Form MSD
- Form N-14
- Form N-18F1
- Form N-18F1
- Form N-30B-2
- Form N-54A
- Form N-8A
- Form N-CSR
- Form N-MFP
- Form N-PX
- Form N-Q
- Form TTW
- Form TA-1
- Form T-3
- Form SC 14F1
- Form SE
- Form SP 15D2
- Form SUPPL
- Form 10-12G
- Form 18-K
- Form SD
- Form STOP ORDER
- Form TH
- Form 1
- Form 19B-4(e)
- Form 40-APP
- Form 497
- Form ABS-15G
- Form DRS
- Form MA
- Form UNDER
- AI sentiment
- Access guide
- Academy
- Term of service
- GDPR compliance
- Contact Us
- Question Center
| Font Size: |
Financial Statement
Financial statement provides detailed view of the financial condition of publicly traded companies filing XBRL report (both regular XBRL and inline XBRL) with the SEC. The earliest available year is 2013 (literally 2011 as most annual reports include report on previous one or two years), and users can trace back up to 10 filing years through webpage access (The XBRL reports will be kept in database (XBRL-minisql) for 20 years for data portal access). The data in original XBRL filings are directly used to generate the financial statement tables, thus any changes (e.g. new filing, amendment) are reflected immediately once XBRL filing is submitted.
Financial statement is the most important source of information that can help investors to determines the value of a company. Investors should expect a good company to have a high quality financial statement with good integrity, consistency, and accuracy.
Each financial statement is composed of four major parts (tables).
Document and Entity InformationConsolidated Balance Sheet
Statement of Cash Flow
Statement of Operation
Document and Entity Information
It contains basic information about an XBRL filings such as the filing type (e.g. 10-Q, 10-K, 10-Q/A, 10-K/A), whether an amendment filing, fiscal year/period focus, and amount of outstanding shares at the time of filing. The tables below shows the document and entity information of GOOG (Alphabet INC.) and AAPL (Apple INC.).
GOOG
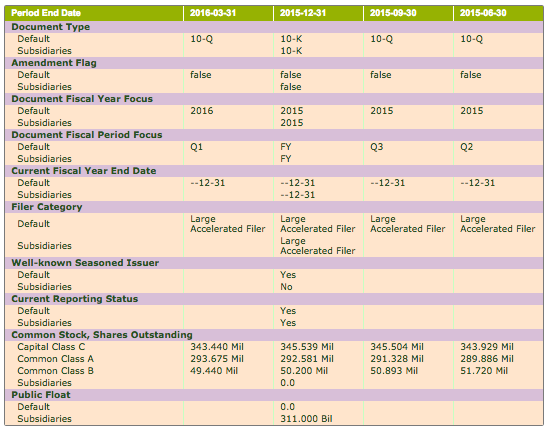
AAPL
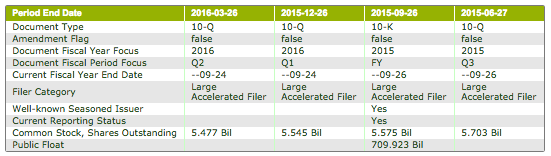
Note that GOOG has slightly different structure as it has meta information (Default Subsidiary, and Three stock classes) in each main segment.
Consolidated Balance Sheet
Balance sheet provides a snapshot of a company's assets, liabilities and shareholders' equity at a specific time point. Consolidated balance sheet is combined balance sheet of a parent company and all its subsidiaries, as if they were a single firm. Balance sheet gives investors an idea of how much a company owns and owes, as well as the amount invested by shareholders. A balance sheet contains three major components including assets, liabilities, and sharesholder's equity, which strictly adhere to the equation: Assets = Liabilities + Shareholders' equity.
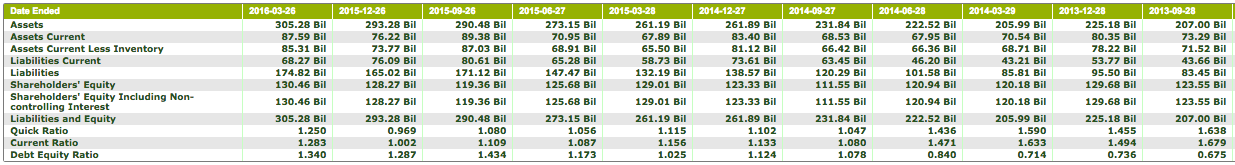
The following table shows the balance sheet of AAPL from 2013-09-28 to 2016-03-26. The items with purple backgound are termed section item, which is composed of various number of child items and a section total.
Original Report (can be turned off through options panel)
In this example, there are 6 section items, namely "Assets, Current", "Assets", "Liabilities, Current", "Liabilities", "Stockholder’s Equity Attributable to Parent", and "Liabilities and Equity". These are typical components found in a balance sheet. Take period 2016-03-26 for example, as mentioned above, the section items strictly adhere to the quation Assets = Liabilities + Shareholders’ equity (i.e. both "Assets" and "Liabilities and Equity" are 305.28 Bil. Note that in rare cases we do see balance sheet with unequal "Assets" and "Liabilities and Equity", which may reflect accounting error); Assets are composed of current assets (i.e. very likely to be converted into cash within the accounting year, which is 87.59 Bil) and non-current assets (i.e. unlikely to turn into cash within the accounting year. It is 305.28 Bil - 87.59 Bil = 217.69 Bil). Similarly, liabilities are composed of current liabilities (68.27 Bil) and non-current liabilities (174.82 Bil - 68.27 Bil = 106.01 Bil). Shareholders’ equity is 130.46 Bil. Thus the equation can be broken down into
current assets (87.59) + non-current assets (305.28) = current liabilities (68.27) + non-current liabilities (217.69) + shareholders’ equity (130.46)
Users can trace back up to 10 years of financial statement history. To make longtitudinal comparisons easier (e.g. trace long term debt for the recent 4 years), child items are shown across reporting periods, and shown as blank if not reported on specific period. In the example above, AAPL has no current mature long term debt until 2015-06-27, so the "Long-term Dedt, Curent Maturities" items are blank (or 0 if it was specifically mentioned in any filings) before 2015-06-27, and the "Long-term Debt, Excluding Current Maturities" items are blank (or if any, same value as "Long-term Debt" item). Starting 2015-06-27, there are 2.5 Bil current mature long-term debt. There is a corresponding switch in the liabilities section from reporting "Long-term Debt" to "Long-term Debt, Excluding Current Maturities".
Report Pattern
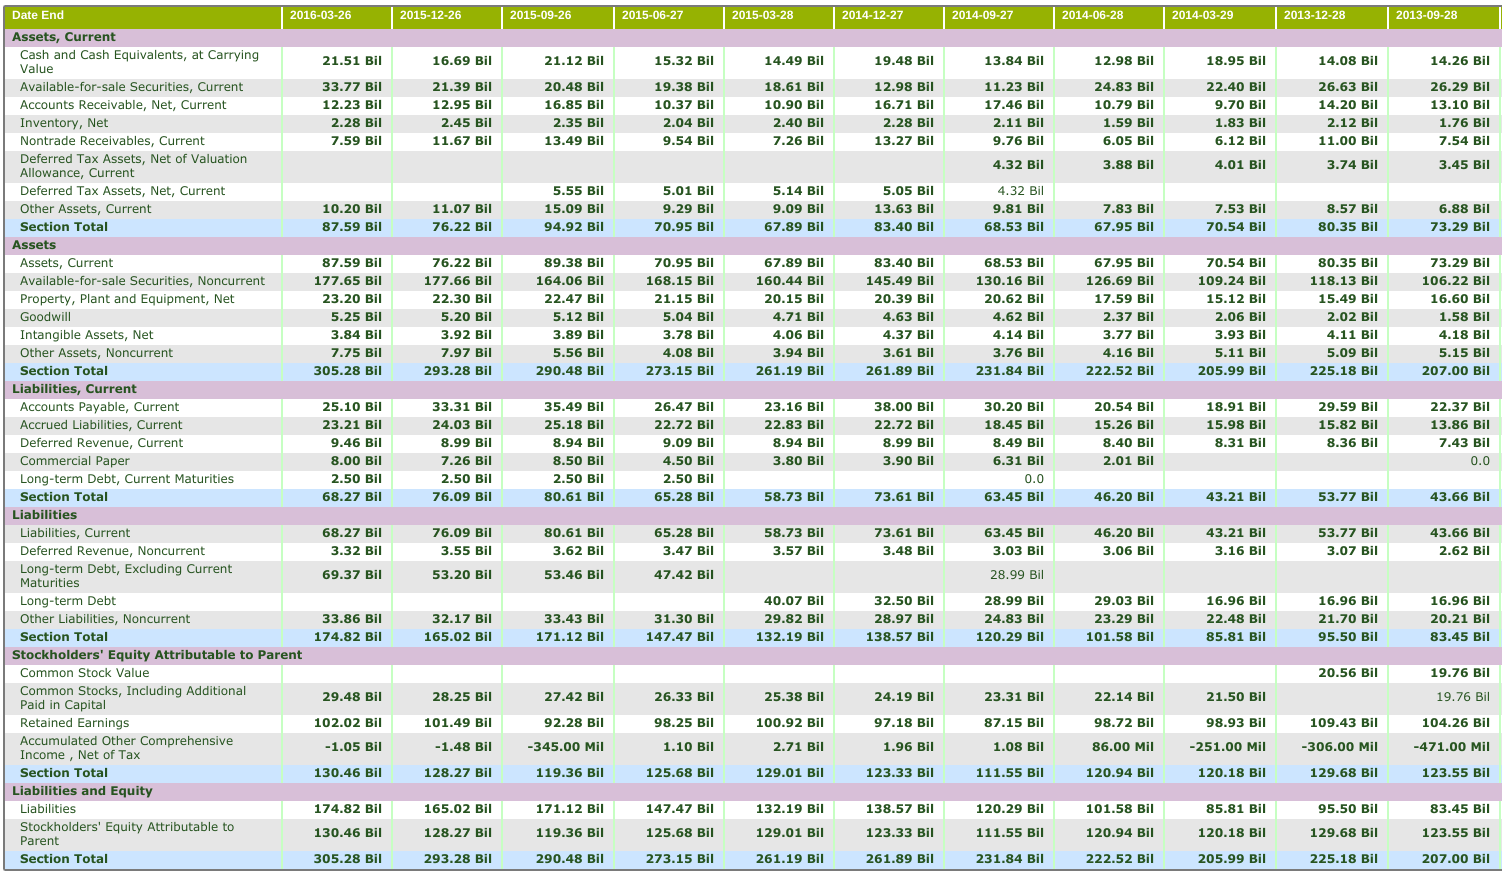
When the "Original Report" option is enabled, and "Report Pattern" in the options panel is set to "Yes" (Default), bold font is used to mark the child items used to calculate section total, given the section item is reported in the calculation architechture of the corresponding filing. Otherwise normal font is used for both child items and section total. In this case the section total is calculated from non-duplicated (e.g. C=A+B; C+B=C) child items. See example below (note that in this example the unit is set to $1000 based through "Format" option in the options panel).
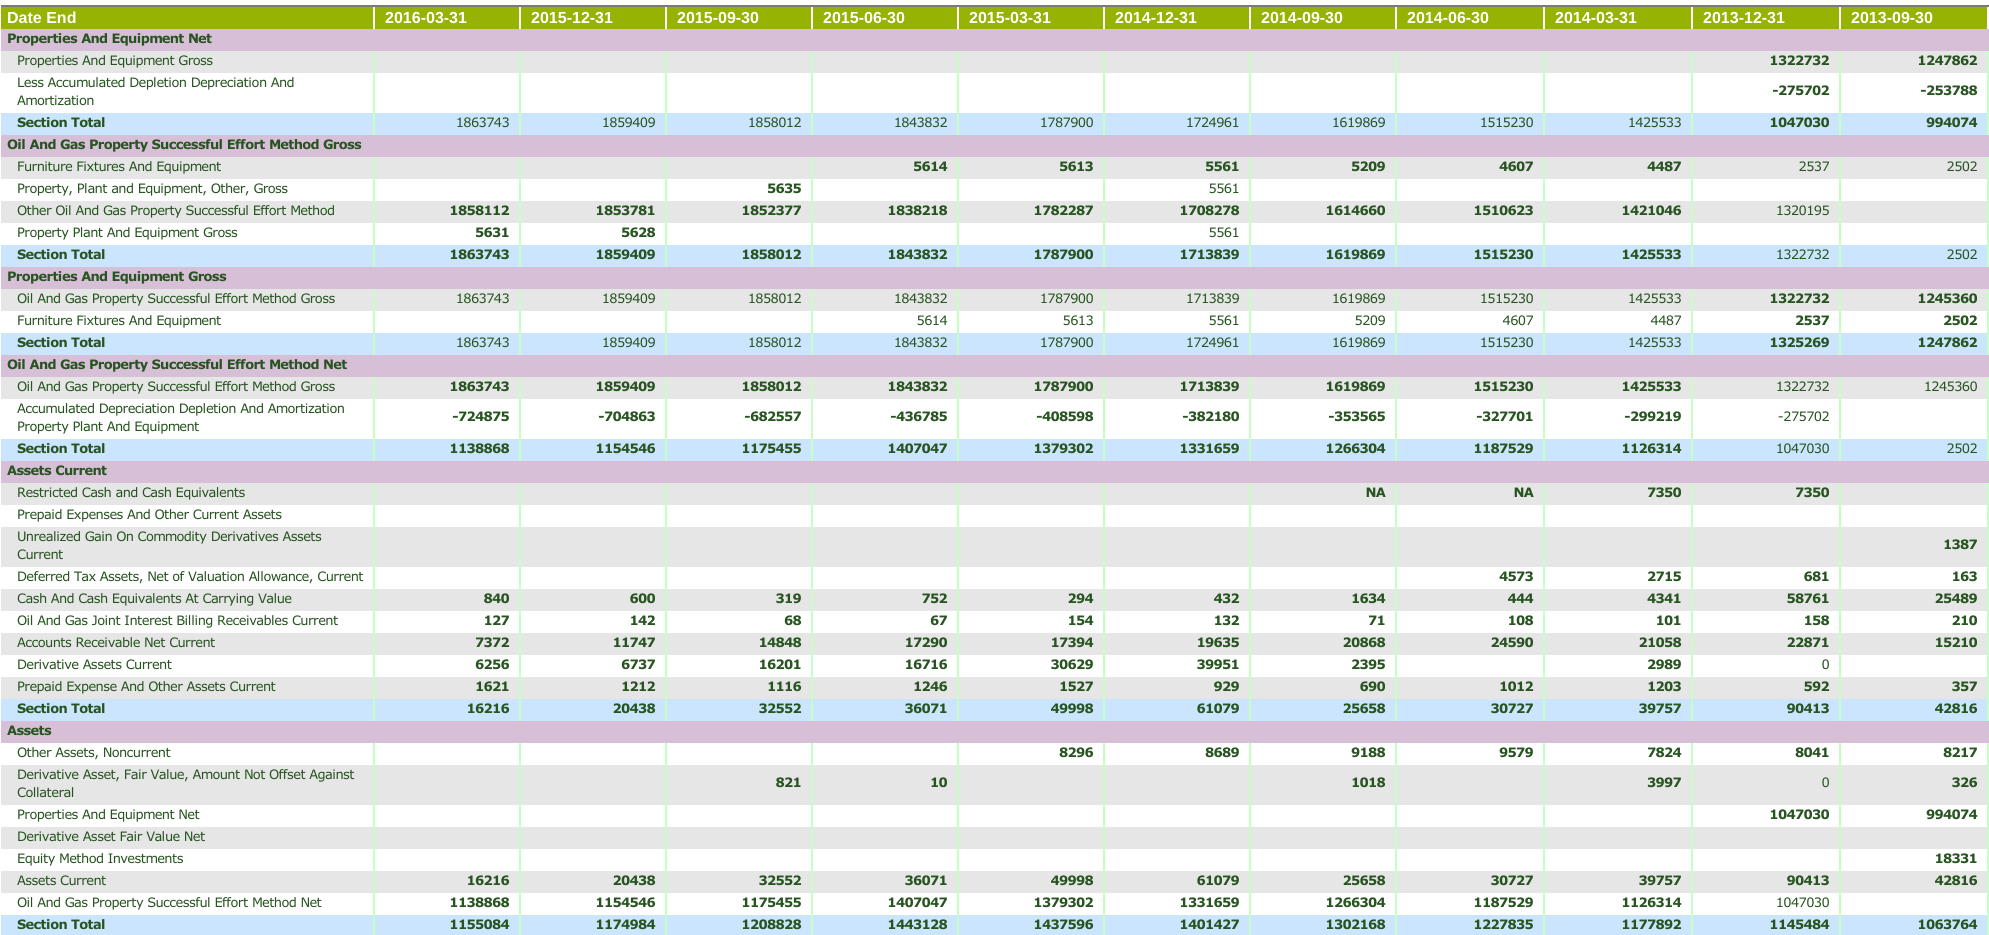
The table above is the asset part (of balance sheet) of AREX (APPROACH RESOURCES INC) from September 2013 to 2016. The company switched from reporting "Properties and Equipment Gross" to "Oil and Gas Property Successful Effort Method Gross" on 2014-03-31 (There is a mistake in the original report of section item "Properties and Equipment Gross" on 2013-12-31, since $1,322,732,000 already included the amount of $2,537,000 "Furniture Fixtures and Equipment"). To make the comparisons consistent across history, section item "Properties and Equipment Gross" is still displayed, but in normal font weight to indicate that the section item was not reported in the calculation architechture of the original filing. Note "Furniture Fixtures and Equipment" is not added to "Properties and Equipment Gross".
Report pattern is useful when a company changes its accounting rules (e.g. switch from reporting revenue as "total revenue" to "total revenue minus cost of goods sold", which is apparently not a good practice but do happens). The accounting rule is sometimes manipulated by the management team to intentionally show a good or bad picture of the company, and give investors wrong projection.
Statement of Cash Flow
Statement of cash flow describes the flow of cash in and out of a business during a certain period of time (usually 3 months or 12 months). It primarily reflects changes in the "cash and cash equivalents" item of balance sheet. Statement of cash flow is composed of three major elements including cash flow from operating, investing, and financing, as well as a section summarizes the net increase(Decrease) of cash during the period.
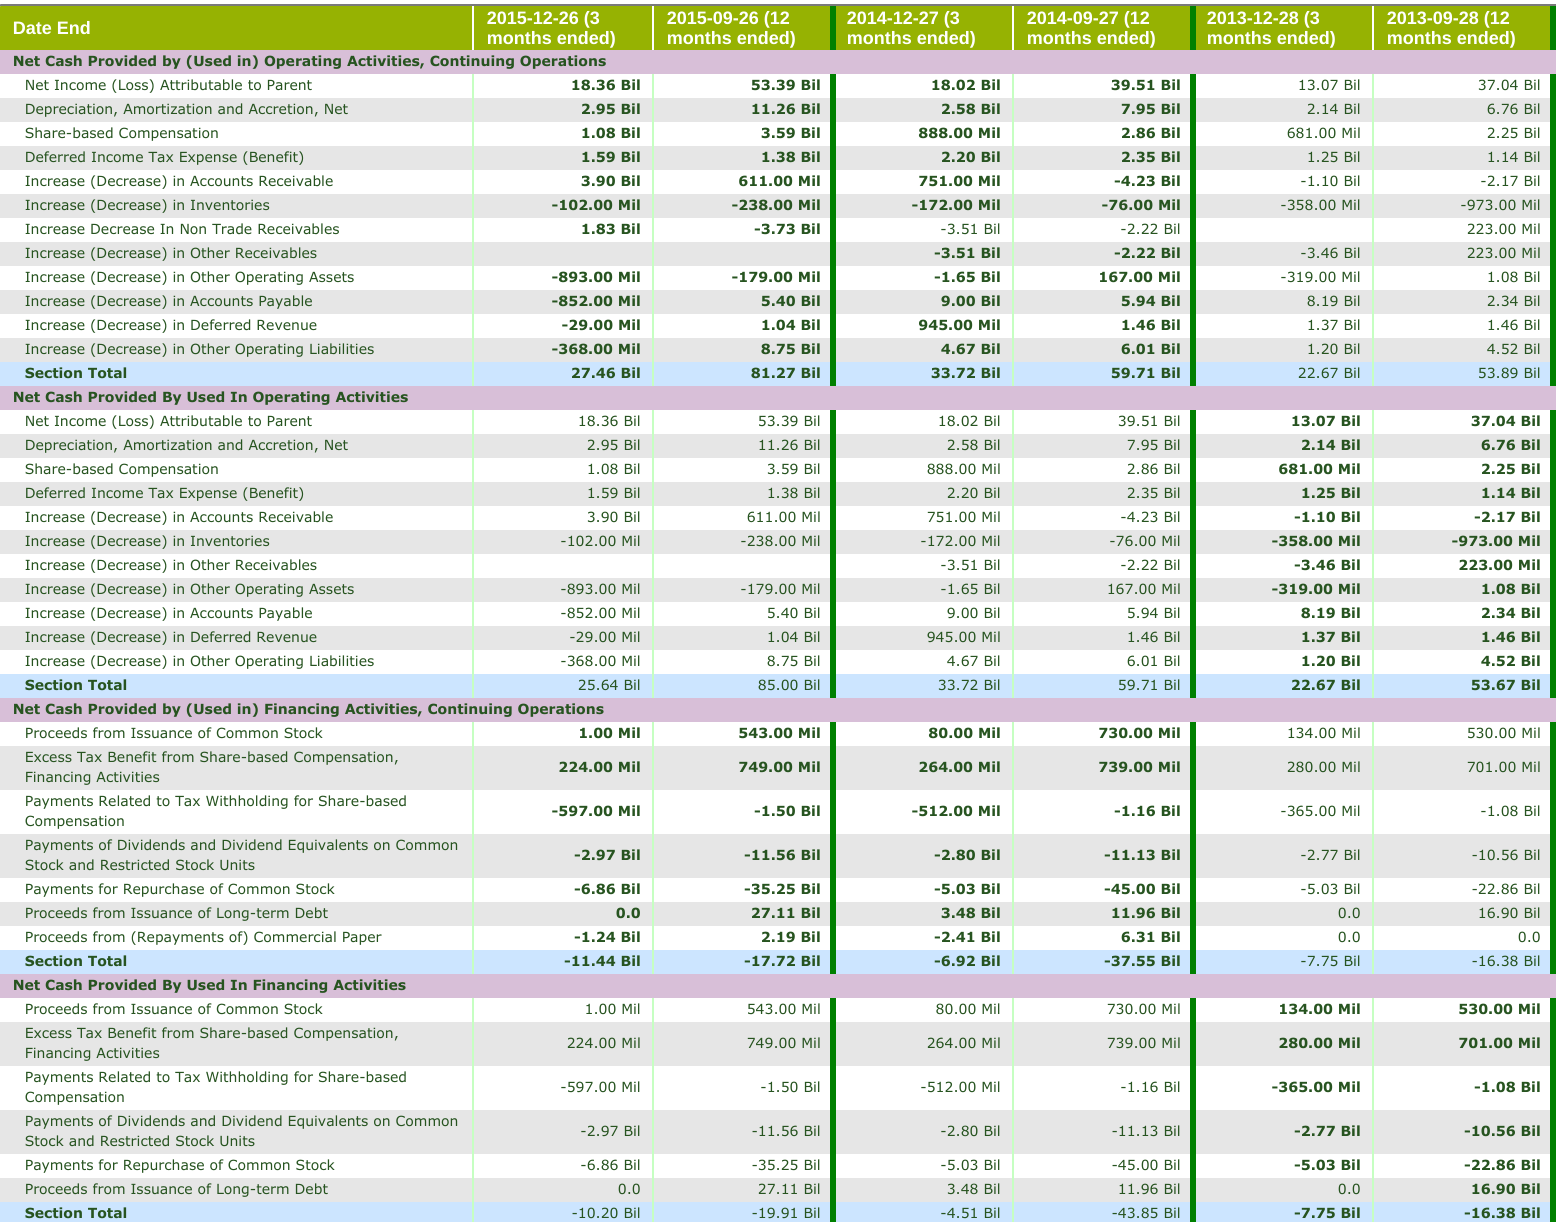
The table below shows the cash flow of AAPL from 2013-09-28 to 2015-12-26, with both 3 months ended and 12 months ended data (with solid green line on the right border). There are 4 section items in this table that can be primarily categorized as cash flow from operating (81.27 Bil, take 12 months ended 2015-09-26 for example), financing (-17.72 Bil), investing (-56.27 Bil), and net increase(decrease) in cash and cash equivalent (81.27 - 56.27 - 17.27 = 7.28 Bil). This 12-month net increase is reflected in the "Cash and Cash Equivalents, at Carrying Value" item of the balance sheet of AAPL (see AAPL balance sheet above) between 2015-09-26 (21.12 Bil) and 2014-09-27 (13.84 Bil): 21.12 - 13.84 = 7.28 Bil.

Original Report (part 1) (can be turned off through options panel)
Original Report (part 2)
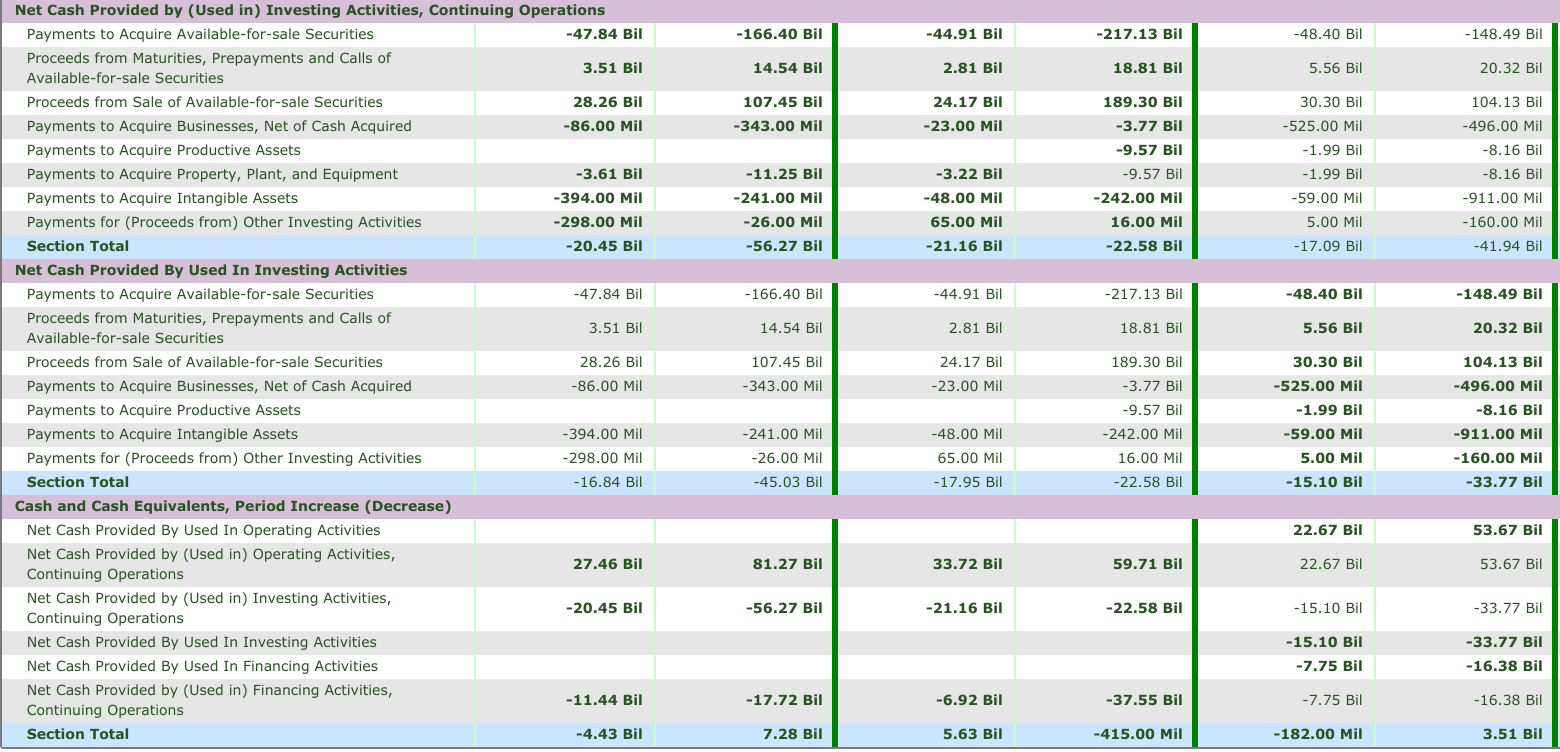
Note that in this example there are two section items for operating cash flow (i.e. with/without continuing operation), and the same for financing, and investing cash flow. This is because AAPL switched to report cash flow with continuing operations on 2014-09-27. The items shown in normal font weight are not reported in the calculation architechture of the original filing, but still displayed for comparison purpose (need to set report pattern to "Yes". The section totals shown in normal font weight are for reference only).
Statement of Operation
Statement of operation (also called income statement, statement of income, earning report) describes the operation result of a business during a certain period of time (usually 3 months or 12 months). The bottom line of statement of operation, often named "Net Income (Loss)", is the starting item of cash flow from operating.
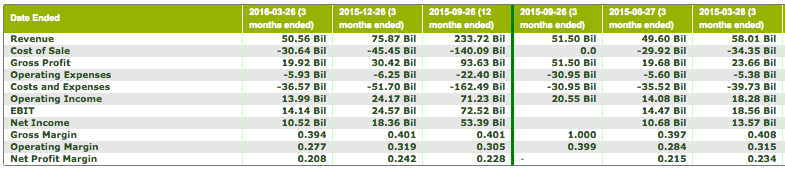
Statement of operation is composed of four major section items including gross profit, operating expenses, operating income (loss), and net income (loss). The table below shows the statement of operation of AAPL from 2015-03-28 to 2016-03-26.
Original Report (can be turned off through options panel)
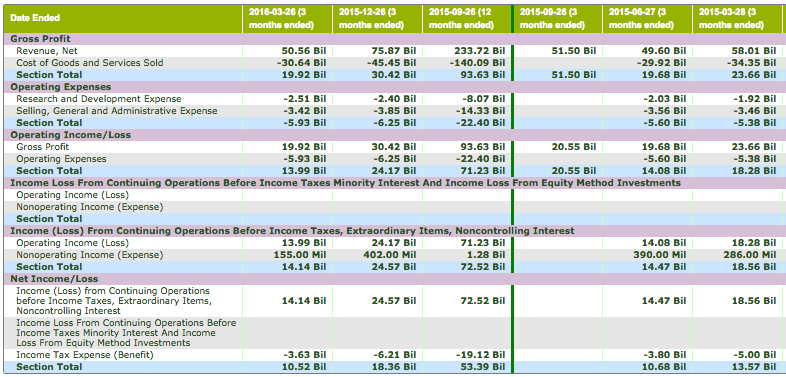
Take 3 months ended at 2015-12-36 for example. Gross profit (30.42 Bil) is the difference between revenue (75.87 Bil) and "Cost of Goods and Services Sold" (-45.45 Bil). Operating expenses* (-6.25 Bil) is the sum of "Research and Development Expense" (-2.4 Bil) and "Selling, General and Administrative Expense" (-3.85 Bil). Operating income (24.17 Bil) is the difference between gross profit (30.42 Bil) and operating expenses* (-6.25 Bil). Overall income before tax (24.57 Bil) is the sum of operating income (24.17 Bil) and non-operating income (0.4 Bil). The net income after tax for the 3 months ended 2015-12-36 is thus (24.57 - 6.21(tax) = 18.36 Bil). All information can be put in a single equation as shown below.
* Katelynn's Report automatically converts child items appearred in costs or expenses related parent sections by multiplying -1 to the original value.
net income after tax (18.36) = revenue (75.87) - cost of goods and services (45.45) + operating expenses (-6.25) + non-operating income (0.4) + tax (-6.21)
The net income after tax (18.36 Bil) also appearred as the first child item of cash flow from operating (see AAPL statement of cash flow above) for the 3 months ended at 2015-12-26.
Several key ratios derived from statement of operation including gross margin (gross profit/revenue), operating margin(operating income/revenue), and net profit margin (net income/revenue) are also calculated and displayed. Note the ratios shown here are slightly different from the ratio shown in the "Advances Query" page, which uses average value over previous several periods.
About Original Report
Katelynn's Report has a group of accounting and XBRL experts to make sure each financial statement being properly analyzed and presented. However, it is still highly recommended for investors to look at the original financial statement before making investment decision. Below is a brief list of the benefits.
- A good company usually has a clear, concise, and consistently formatted financial statements across its reporting history (as AAPL shown above). On the reverse side, if a company frequently changes accounting rule or calculation architecture (which usually results in super long table, or table with lots of blank areas), it is likely the company 1) does not have a stable/consistent business for generating profit, or 2) has a poor accounting team (could be lethal for a publicly traded company), or 3) has a poor performance and is trying to hide something.